Based on reported import licenses, US flat products imports rose 27% from 548,000 short tons in February, 2023 to 697,000 tons in February, 2024. The increase was mainly due to higher hot dip galvanized imports from Canada, South Africa, Vietnam, Austria and the UAE. Cold rolled imports also rose significantly from Australia and Canada.
US flat products imports in the first two months of 2024 were 22% higher than in the same period last year. Imports of all product categories rose, though the highest volume increases came from hot dip galvanized (+27%) and cold rolled (+28%).
China produced 77.2 million tonnes in January, accounting for 52% of world output and falling 6.9% compared to January, 2023. In other parts of Asia, Indian crude steel production rose 7.3% on last January, Japanese output rose 0.6%, as did South Korean output by 1.5%.
European Union crude steel production fell 1.8% on last January following a 0.9% decline in Germany. North American output fell 2.1% with US output down 0.3%. Other significant changes compared to last January include a 24.7% rise in Turkey and a 39.3% increase in Iran.
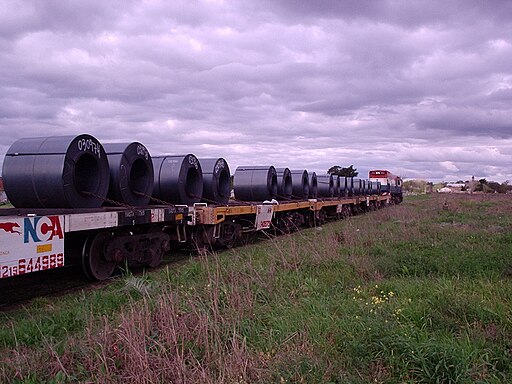
Transportation of rolled steel coils on an open loading platform, Aygir station, Russia, September 2023 by Vasily Astanin, CC BY-SA 4.0 https://creativecommons.org/licenses/by-sa/4.0, via Wikimedia Commons
While past episodes have focused on other parts of the world, this episode concentrates on Brazil and how the structure of its energy supply, mining, and steelmaking industries will define the path to decarbonization. Gerdau is the largest producer of charcoal in the world, so if you are interested in the role of biomass and charcoal in low-carbon steelmaking, this is your episode.
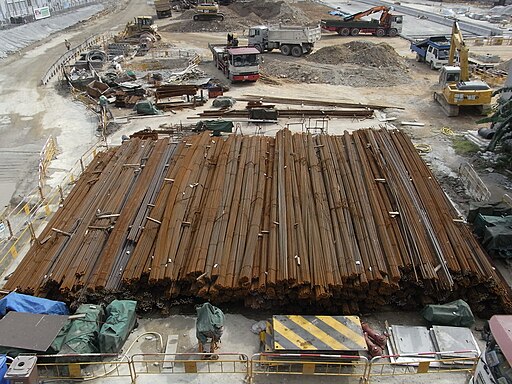
Based on reported import licenses, US long products imports declined 3% from 314,000 short tons in January, 2023 to 304,000 tons in January, 2024.
According to license data, rebar imports declined mainly from Algeria, Mexico, and Turkey, while parallel flange sections imports fell primarily from Spain, the United Kingdom, and the UAE. In contrast, wire rod imports rose compared to last January due to higher imports from Ukraine, Poland, and Brazil.
Based on reported import licenses, US flat products imports increased 8% from 660,000 short tons in January, 2023 to 712,000 tons in January, 2024. The increase was mainly due to higher hot rolled imports from South Korea, Brazil, and Canada.
US flat products imports over the last six months (August, 2023 to January, 2024) were 3% lower than in the same period the year before, with gains from cut plate (+20%) and hot rolled (+2%) offsetting declines from cold rolled (-21%) and hot dip galvanized (-5%).
US flat products import licenses
January 2016 to January 2024
Short tons
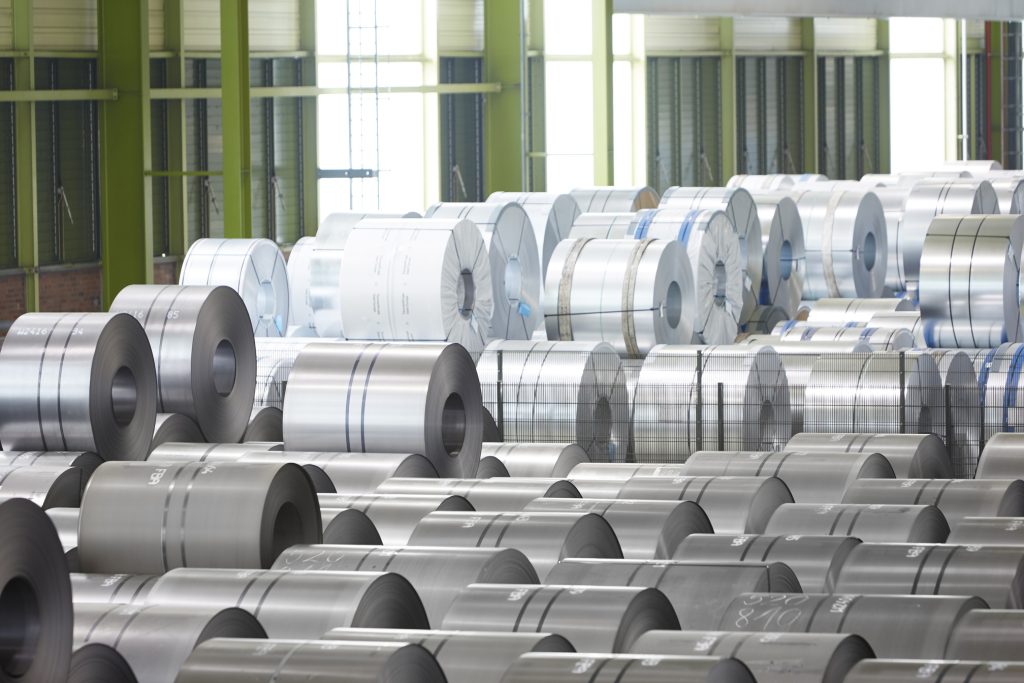
“Steel coils in storage in the hot-dip coating line, designed by Friedrich-Ernst von Garnier”, thyssenkrupp AG, Brueckenhausen Plant, from Worldsteel Image Library
Episode 5 of The Green Steel Challenge podcast has just been released featuring Danieli Group’s Giacomo Mareschi Danieli. He discusses how energy availability is key to building low-emissions steelmaking plants and what he sees as the most technically advanced projects around the world.
The podcasts are produced by the Korf Foundation and Kallanish Commodities and the discussion is all about how exactly we can deliver Green Steel. Other episodes will include André Bier Gerdau Johannpeter at Gerdau and John Lichtenstein at World Steel Dynamics..