The four worst post-war (WWII) declines in US steel demand occurred in 1958, 1975, 1982 and last year, 2009. In the recent US Steel Q2 conference call, US Steel CEO John Surma wisely reflected, in the context of how much capacity to keep running, that some of the recent steel demand destruction could be permanent.
We think there is a pretty good chance that the level of consumption, which was implied by what the shipments were with the industry back in the middle part of the year was unsustainably low, probably moving back into something that’s more aligned with what real end use demand is. We don’t really have a good idea what that is, until we have a little bit more time to assess it. I don’t think for the long term it’s likely that the U.S. Steel consumption per capita will be one half of what it’s been for the last 20 years. That seems unlikely, but it’s possible. From: SeekingAlpha
He’s right. Dramatic collapses seldom lead to half the per capita consumption that prevailed before the collapse, but they do lead to longer term demand damage that seems hard to repair. In the three prior notable crises, demand per capita in the 5 years prior to the year of collapse was 17%, 8% and 19% higher than it was in the 5 years after the critical year. On average, that means there was a 15% decline in per capita consumption in the 5 years following a demand crisis.
And it’s hard to come back. After 1958, it took 6 years to return to the per capita consumption of 1957. We never got back to the levels achieved just prior to 1975. And it took 15 years to recover the specific level of 1981, but never the 5-year average prior to 1982.
What might happen post-2009? A 15% decline in overall demand would mean an average annual loss of about 15MT (short) between 2010 and 2014 unless the reordering of the global economy causes a different trajectory for the US steel economy. In other words, deciding on appropriate capacity levels is going to be a very tough decision.
The Australia National University recently held a conference called China Update 2010. A complete list of papers presented at the conference can be found here. Among the papers was a very interesting analysis of China’s steel intensity. See paper #5 China’s metal intensity in comparative perspective by Huw McKay, Yu Sheng and Ligang Song.
The authors attempt to compare China’s steel intensity to that of other countries at similar stages of economic development. The authors’ main methodological contribution to this type of comparative steel intensity analysis is to adjust for some of the unique structural characteristics of China’s economy and its industrialization process. The main conclusions of the analysis are:
- China’s steel intensity is likely to peak around 2024 when GDP per capita reaches $15,000
- The peak level of steel demand will be 700-800 kg per capita, which suggests China will consume 1.1 billion tonnes of steel by then, up from 542 million tonnes consumed in 2009
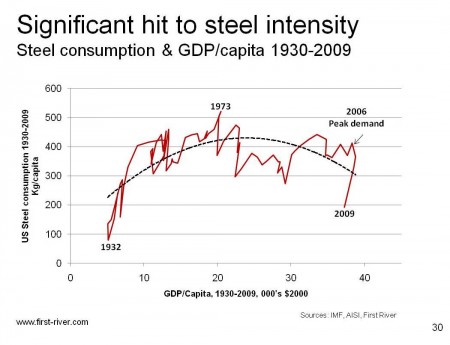
As can be seen in the graph below, if China peaks at 700-800 kg per capita, they would be above average but below South Korea. By comparison, US steel intensity peaked at 525 kg/capita in 1973 and is now below 400.

The authors are careful to point out that making projections into the distant future based on the current structure of GDP and industrialization trends is fraught with risk, and they expect that China’s actual development path will deviate from the projections provided in the paper. On the other hand, their methodology is more sophisticated than many of the steel intensity projections we’ve seen and it provides at least one point of reference regarding how long China’s steel intensive phase of development might last and how high demand might go. Any thoughts?
The IMF recently updated its forecast for world GDP growth in the latest World Economic Outlook. The global economy is projected to grow at 4.6% this year and 4.3% next year. If you look at the historical relationship between world GDP growth and world steel demand growth, the IMF forecast would lead one to expect steel demand to grow by 5-6% this year and next.
This seems low to me. Through June of this year, world crude steel production is almost 30% higher than it was thru June last year. Even if the global economy slows down in the second half of 2010, it seems unlikely that demand will grow by only 5% on the year.
Why is the model failing? I think its because the structure of global GDP is changing. As developing economies account for a greater proportion of global GDP growth, their greater steel intensity will cause steel demand to grow faster than the historical relationship suggests. So while the GDP/steel demand relationship is a useful heuristic, be careful of using it too directly.
Ternium, Gerdau, and Gerdau Ameristeel recently announced Q2 2010 earnings. If you want to read the earnings announcements, I’ve provided links below.
All three companies reported improved EBITDA per ton in Q2 relative to Q1. Ternium had the strongest second quarter, reporting EBITDA per ton of $202 up from $183 in Q1. Gerdau saw EBITDA per ton rise to $193, from $172 in Q1. Finally, Gerdau Ameristeel’s EBITDA per ton was $77 in Q2, only slightly higher than the $74 reported in Q1.
Most of the companies tracked in the Nerds of Steel earnings spreadsheet have now reported Q2 results. As is typically the case, the leaders in terms of profitability were Posco, Ternium, and Gerdau.
Sorry for the delay in posting this release from worldsteel which appeared on July 20th. Global liquid steel production dipped a little over 4% in June compared to the prior month but only a little over 1% on a daily output basis. No region bucked the trend. There seems to be a considerable amount of estimating in the worldsteel data, so expect revisions. According to the release, world steelmaking capacity utilization remained slightly over 80%. All the data is available below.
ArcelorMittal announced Q2 financial results today. The press release is here. EBITDA was $119 per ton in Q2 up from $80 in Q1. This is the second highest Q2 EBITDA per ton achieved so far among companies tracked on the Nerds of Steel earnings spreadsheet.


