This is the Steel Dynamics Q3 conference call file.
{ 0 comments }
Here’s a graphical version of the SIMA versus actual import data that Jessica posted. It includes only carbon/alloy finished long products. The data is shown in short tons. The SIMA license data comes from this website of the import administration. It’s published every Tuesday evening.
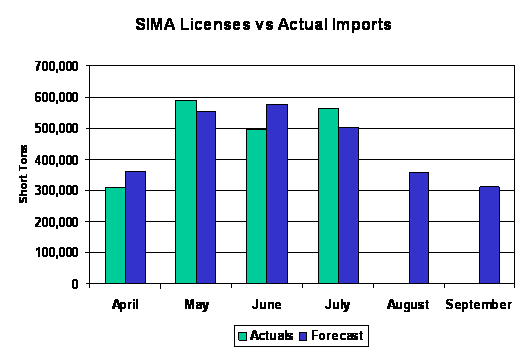
The analysis here is an attempt to exploit the early availability of the license data to estimate the imports for the recently completed month. This is necessary because the actual import data which comes from the Department of Commerce trails the month end by 6 weeks. There is a preliminary DOC estimate published about three weeks after month end, but acceptable license data is usually available before then and provides more detail than the DOC preliminary report. In the case of August for instance, the DOC preliminary estimate is of a 39% decline in all imports from the July level. The license data shown here indicate a 37% decline for this group of finished long products.
{ 0 comments }
License data for the month listed is collected as of the date listed after each month (about 6 weeks after month-end)
| Licenses vs. Actuals | ||||
| April (5/15) | May (6/12) | |||
| Licenses | Actuals | Licenses | Actuals | |
| Rebar | 109,419 | 118,021 | 236,809 | 240,524 |
| Wire Rod | 130,411 | 86,792 | 177,187 | 212,986 |
| MBQ | 20,834 | 18,663 | 22,167 | 21,936 |
| Lt Shps | 18,541 | 16,213 | 22,711 | 22,954 |
| PFS | 27,265 | 22,901 | 47,593 | 39,027 |
| SA&C | 33,848 | 24,578 | 27,464 | 35,058 |
| AOSS | 20,950 | 22,057 | 18,297 | 18,246 |
| Total | 361,267 | 309,225 | 552,227 | 590,731 |
| June (7/17) | July (8/14) | |||
| Licenses | Actuals | Licenses | Actuals | |
| Rebar | 284,334 | 220,406 | 230,262 | 291,272 |
| Wire Rod | 174,608 | 166,125 | 154,147 | 152,504 |
| MBQ | 22,127 | 20,029 | 25,322 | 23,799 |
| Lt Shps | 21,077 | 18,444 | 23,342 | 25,401 |
| PFS | 30,509 | 27,716 | 29,411 | 28,553 |
| SA&C | 25,150 | 23,334 | 27,901 | 27,757 |
| AOSS | 19,370 | 19,654 | 11,917 | 13,512 |
| Total | 577,176 | 495,708 | 502,302 | 562,798 |
| Forecasts Only | ||||
| Aug (9/18) | Sept (10/16) | |||
| Licenses | Licenses | |||
| Rebar | 119,305 | 90,600 | ||
| Wire Rod | 113,418 | 109,710 | ||
| MBQ | 22,467 | 32,918 | ||
| Lt Shps | 17,242 | 16,572 | ||
| PFS | 50,260 | 27,629 | ||
| SA&C | 21,517 | 14,501 | ||
| AOSS | 13,030 | 18,668 | ||
| Total | 357,240 | 310,597 | ||
{ 0 comments }
Gerdau Ameristeel has filed the short form offer document/prospectus for the sale of 110M of its common shares. You can read it on Edgar here.
{ 0 comments }
Below is a 15 minute interview from October 4th with Platts interviewing the LME about steel futures. The LME are naturally very impressed with the interest in steel futures they have seen from steel producers, just about the opposite of the response described in the “SBB Insight: Steel futures prepare to engage the market” circulated October 8th.
[display_podcast]
{ 0 comments }
The IISI published its short range outlook October 8. Here’s the link. It’s not available in any better form than a PDF, but that’s attached, IISI Short Range Outlook 10/8. The summary table is shown below:
| Regions |
2006 |
2007 |
2008 |
% 05/06 |
% 06/07 |
% 07/08 |
| EU-27 |
184.9 |
192.2 |
195.0 |
11.4 |
4.0 |
1.4 |
| Other Europe |
27.2 |
29.3 |
31.0 |
11.0 |
7.8 |
5.7 |
| C.I.S. |
50.0 |
59.8 |
65.2 |
18.1 |
19.5 |
8.9 |
| N.A.F.T.A. |
155.7 |
148.1 |
153.9 |
11.5 |
-4.9 |
4.0 |
| Central and South America |
35.6 |
39.5 |
41.6 |
11.8 |
10.9 |
5.2 |
| Africa |
23.1 |
25.1 |
27.5 |
11.4 |
8.9 |
9.5 |
| Middle East |
37.3 |
40.4 |
43.4 |
9.8 |
8.4 |
7.5 |
| Asia (inc. Oceania) |
607.2 |
663.2 |
721.1 |
6.2 |
9.2 |
8.7 |
| Regions |
2006 |
2007 |
2008 |
% 05/06 |
% 06/07 |
% 07/08 |
| World |
1,120.9 |
1,197.7 |
1,278.6 |
8.8 |
6.8 |
6.8 |
| BRIC |
457.8 |
516.6 |
573.9 |
9.8 |
12.8 |
11.1 |
| Rest of the World |
763.5 |
799.6 |
834.8 |
8.7 |
4.7 |
4.4 |
{ 0 comments }


