Based on reported import licenses, US flat products imports rose 105% from 481,000 short tons in January, 2021 to 987,000 tons in January, 2022.
Hot rolled imports rose by the largest volume, up 101% due mainly to higher volumes from Mexico, Canada, Japan and Turkey. Hot dip galvanized imports rose by the second highest volume, following increases from Vietnam, Turkey, and South Africa.
Steel Import Monitor US flat products import licenses
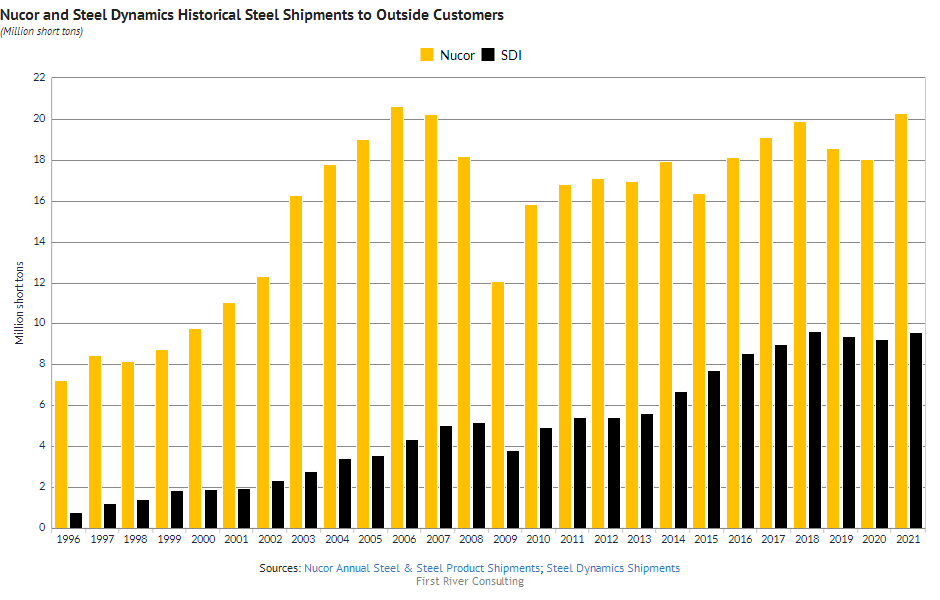
Fourth quarter earnings reports have been published for the top US steelmakers. Nucor reported 20.3 million short tons of steel shipments to outside customers in 2021 and Steel Dynamics reported 9.6 million short tons. So many more details are available including steel shipments by product category, as well as shipments of downstream products if you check out the two Steel Data Room datasets dedicated to Nucor and SDI shipments reports. And all the historical data published over the years is held for you in one place.
As you can see in the chart below, it’s easy to combine data from two different sources in the Steel Data Room. And First River updates the data for you when the new numbers are published, so every time you open your chart, you’ll see the most up-to-date figures.
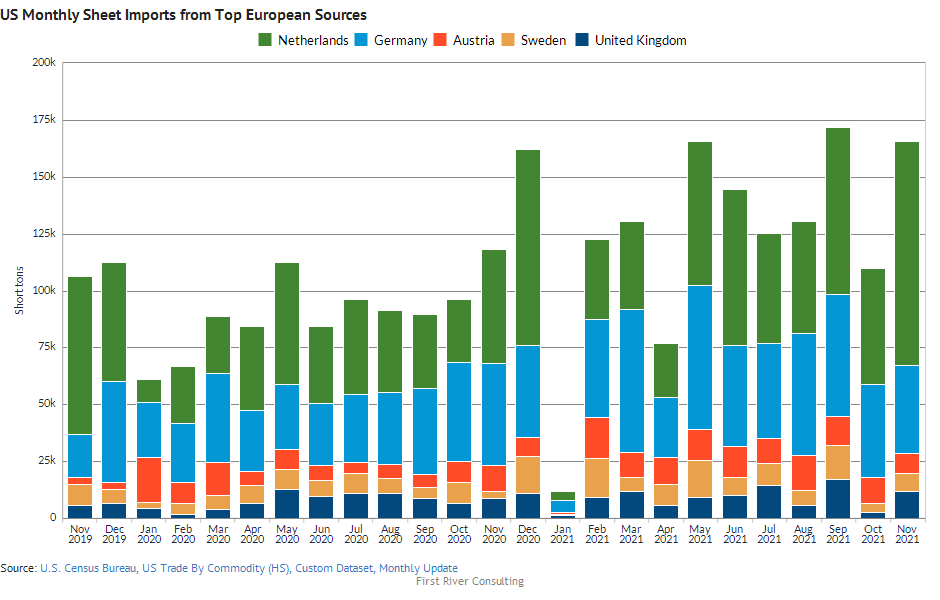
As US tariff agreements with European Union countries and the United Kingdom are changed and renegotiated, we are all closely following US imports from key countries. We use the Steel Data Room’s US Census Bureau steel products dataset to find the data we need.
While using this dataset, you don’t need to mess with the 10-digit trade codes because they are already organized into major steel product categories such as sheet, cold rolled strip, cut to length plate or rebar. In addition, US import and export data is available back to 2013 monthly and annually by country of origin/destination and by US port of entry/exit in volume and in value.
You can easily create great charts in the Steel Data Room like the one below which illustrates how the top European sheet exporting countries to the US have consistently included the Netherlands, Germany, Austria and the United Kingdom. And as soon as the US Census Bureau publishes the December, 2021 data in one week’s time, the chart automatically updates.
Interested in more details? Have a look at what’s available in the Steel Data Room by trying a free 4-week trial.
Worldsteel reported crude steel production in China at 86.2 million metric tonnes in December, 6.8% lower than in December, 2020. Chinese crude steel output in 2021 was 3.0% lower than in 2020 at 1,032.8 million tonnes.
Data from China’s General Administration of Customs show net finished steel exports in December at 4.0 million tonnes, 15.8% higher than in December, 2020. On a full-year basis, net 2021 exports were 57.4% higher than in 2020.
Worldsteel published December, 2021 and full-year 2021 world crude steel production yesterday. World steel output was 158.7 million metric tonnes in December, 3.0% lower than in December, 2020. Full-year 2021 steel production was 1,911.9 million tonnes, 3.6% higher than in full-year 2020.
China produced 1,032.8 million tonnes of crude steel in 2021, accounting for 54% of world output. China’s production fell 3.0% between 2020 and 2021 while production in the rest of the world rose 12.6%. Asian output outside of China showed an 13% production increase between 2020 and 2021 with India +17.8%, Japan +14.9%, and South Korea +5.2%.
Crude steel production in the European Union 27 countries rose 15.4% with German output +12.3%, Italian output +19.7%, Spain +27.7%, and France +20.3. In North America, crude steel production rose 16.6% year-on-year with US output up 18.3%, Mexico up 9.5%, and Canada up 16.2%.
In addition, production rose between 2020 and 2021 in Russia (+6.1%), Turkey (+12.7%), and Brazil (+14.7%), but fell in Iran (-1.8%).
Based on reported import licenses, US long products imports increased 58% year-on-year from 178,000 short tons in December, 2020 to 280,000 tons in December, 2021. Licenses indicate that the increase was mainly due to higher wire rod imports from Mexico, India, Algeria, South Korea, and Egypt.
US long products imports for the full year 2021 were 50% higher than in 2020 with the highest volume increase coming from wire rod (+73%), followed by rebar (+33%), parallel flange sections (+47%), and light shapes (+75%).
US long products import licenses
January 2015 to December 2021
Short tons
Amazon Tower II biospheres under construction by SounderBruce from Seattle, United States, CC BY-SA 2.0 <https://creativecommons.org