Based on reported import licenses, US flat products imports rose 118% from 468,000 short tons in November, 2020 to 1,018,000 tons in November, 2021. The increase was mainly due to higher hot rolled imports from Japan, the Netherlands, Canada and Mexico. Hot dip galvanized imports also rose significantly from Vietnam and Turkey.
Flat products imports in the first eleven months of 2021 were 66% higher than in the same period last year. Comparing 2021 to 2020, imports of hot rolled rose 116%, imports of cut plate increased 66%, imports of cold rolled rose 34%, and imports of hot dip galvanized rose 29%.
US flat products import licenses
January 2014 to November 2021
Short tons
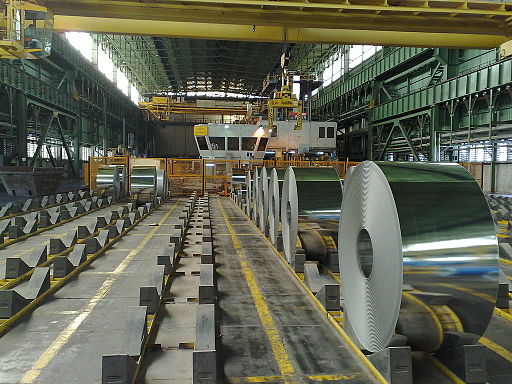
HDG steel storage at Novolipetsk (NLMK Group) from Worldsteel Image Library by worldsteel / Robert Kolykhalov
Worldsteel reported crude steel production in China at 71.6 million metric tonnes in October, 23% lower than in October 2020. Chinese crude steel production in the first ten months of 2021 was 2% lower than in the first ten months of 2020.
Data from China’s General Administration of Customs show net finished steel exports (exports minus imports) in October at 3.4 million tonnes, 60% higher than in October 2020. Net finished steel exports in the first ten months of 2021 were 67% higher than in the first ten months of 2020.
China produced 71.6 million tonnes in October, accounting for 49% of world output and falling 23.3% on October 2020. In other parts of Asia, Indian steel production rose 2.4% on last October, Japanese output rose 14.3%, but South Korean production fell 1.0%.
European Union 27 crude steel production rose 6.4% on last October following a 7.0% increase in Germany. North American production rose 16.9% with US output up 20.5%. Other significant changes compared to last October include a 15.3% drop in Iran, a 10.4% increase in Brazil, and an 8.0% rise in Turkey.
Based on reported import licenses, US flat products imports rose 96% from 513,000 short tons in October, 2020 to 1,006,000 tons in October, 2021. The increase was mainly due to higher hot rolled imports from Turkey, Canada and Mexico. Imports of all other flat products categories rose on October, 2020, with cut plate up 141%, cold rolled up 52%, and hot dip galvanized up 45%.
Flat products imports in the first ten months of 2021 were 58% higher than in the same period last year. Comparing 2021 to 2020, imports of hot rolled rose 104%, imports of cut plate increased 67%, imports of cold rolled rose 29%, and imports of hot dip galvanized rose 22%.
US flat products import licenses
January 2014 to October 2021
Short tons
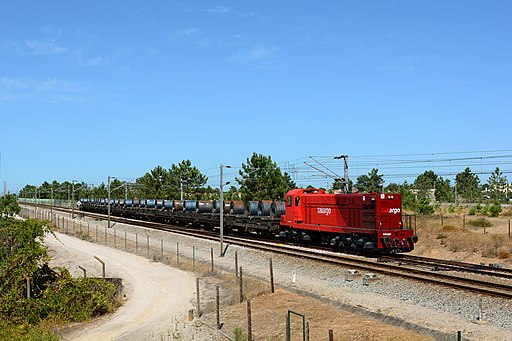
“Ex-CP and now Takargo owned 1552 built by MLW (Montreal Locomotive Works) roaring under hot summer sun with a heavy steel coil train from Setúbal harbor to Siderurgia Nacional.” by Nelso Silva from Porto, Portugal, CC BY-SA 2.0 https://creativecommons.org/licenses/by-sa/2.0, via Wikimedia Commons
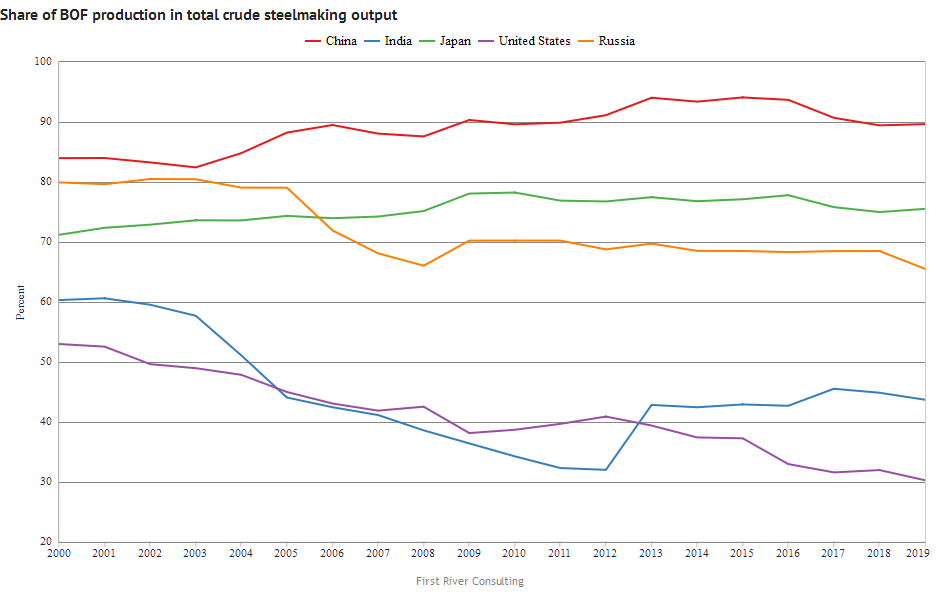
If you are following the current debate about steelmaking carbon emissions, you might want to remind yourselves about who’s producing steel through the BOF route and who’s producing it through the EAF route. The Steel Data Room’s dataset “World Steel Association Steel Statistical Yearbook” makes that easy.
Let’s look at the world’s top five steelmaking countries. China, the worlds largest producer currently account for 51% of world output, now produces 90% of its crude steel output through the BOF route, up from 84% in 2000. In contrast, the world’s second largest producer, India, at 7% of world production, now produces 44% of crude production through the BOF route, down from 60% in 2000. The BOF share of the world’s third largest steelmaker, Japan, has risen from 71% to 76% between 2000 and 2019. And of course the real outlier among the top five world steel producers is the world’s fifth largest producer, the United States, which produced 53% through the BOF in 2000 but 30% through the BOF in 2019.
Interested in seeing more data? Try a Steel Data Room free trial to find the steel industry information and charts you need.
Worldsteel reported crude steel production in China at 73.8 million metric tonnes, 21% lower than in September, 2020. Chinese crude steel production in the first nine months of 2021 was 1% higher than in the same period last year.
Data from China’s General Administration of Customs show net finished steel exports (exports minus imports) in September at 3.7 million tonnes, 289% higher than in September, 2020. Net finished steel exports in the first nine months of 2021 were 67% higher than in the first nine months of 2020.