China produced 73.8 million tonnes in September, accounting for 51% of world output and falling 21.2% on September, 2020. In other parts of Asia, Indian steel production rose 7.2% on last September, Japanese output rose 25.6%, but South Korean production fell 5.0%.
European Union 27 crude steel production rose 15.6% on last September following a 10.7% increase in Germany. North American production rose 19.2% with US output up 22.0%. Other significant changes compared to last September include a 51.4% decline in Iran and a 15.3% production increase in Brazil.
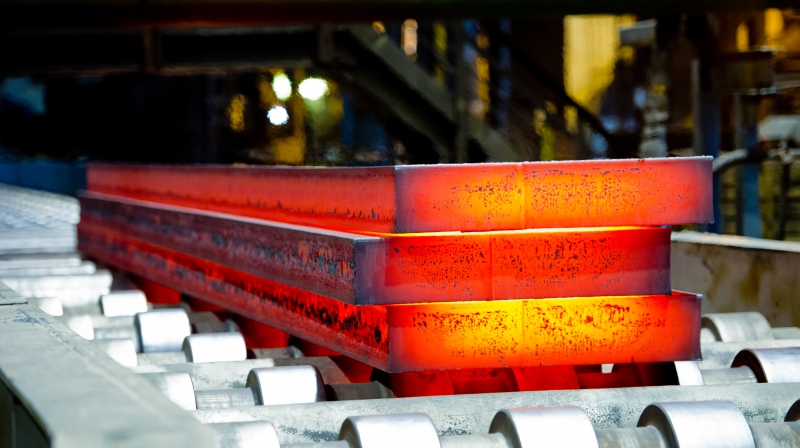
Slabs at Novolipetsk (NLMK Group) from Worldsteel Image Library by worldsteel / Robert Kolykhalov
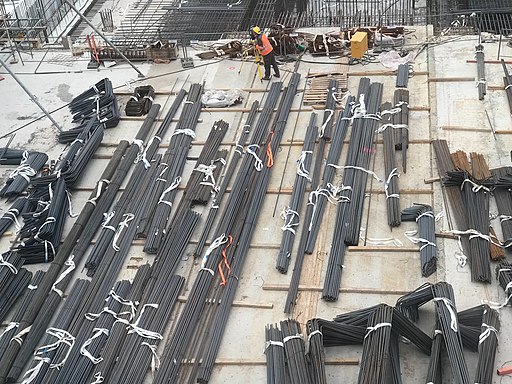
Based on reported import licenses, US long products imports rose 122% from 167,000 short tons in September, 2020 to 369,000 tons in September, 2021. Licenses indicate the increase was mainly due to higher rebar imports from Algeria, Turkey and Mexico. Wire rod imports also rose significantly year-on-year from a number of countries including Egypt and Algeria.
US long products imports in the first nine months of 2021 were 31% higher than in the same period last year with the largest import volumes rising for wire rod (+51%), rebar (+14%), and light shapes (+67%).
In its latest Short Range Outlook (SRO), published today, Worldsteel forecasts world steel demand to grow by 4.5% in 2021 to 1.855 billion metric tonnes. Worldsteel expects steel demand in China to decline by 1% in 2021, a 4.0% revision downward since April’s SRO, while it expects demand outside China to grow by 11.5%, a 2.2% revision upward since April’s forecast. As a result, Chinese steel demand as a portion of world demand will decline from 56% in 2020 to 53% in 2021.
Steel demand is expected to grow by another 2.2% in 2022 to 1.90Mt. Steel demand in China is expected to rise by 1.0% in 2022 while demand outside China is forecast to rise by 4.7%. The largest steel-consuming countries accounting for the increase outside China include India, where demand is expected to grow by 6.8% in 2022, and the US, where demand will grow by 5.7%.
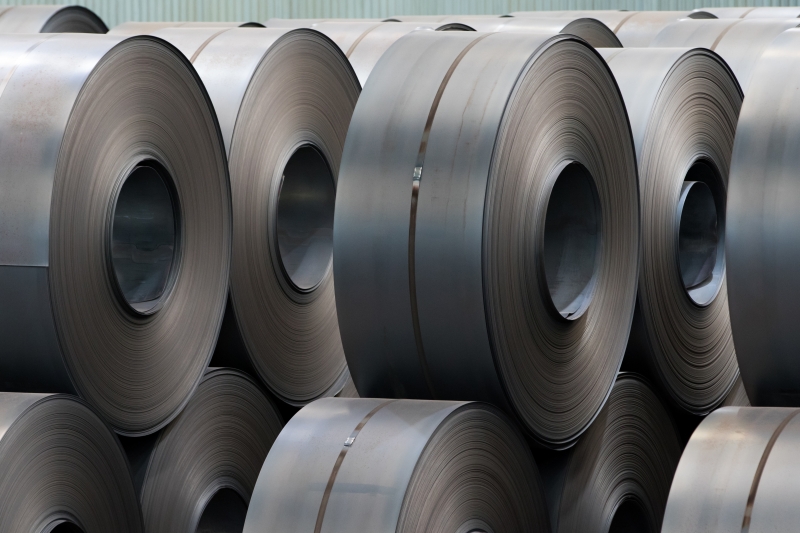
Hot rolled coils in storage at POSCO Pohang Steelworks from Worldsteel Image Library
Based on reported import licenses, US flat products imports rose 67% from 509,000 short tons in September, 2020 to 850,000 tons in September, 2021. The increase was mainly due to higher hot rolled imports from Canada, Turkey, Mexico, and the Netherlands. Imports of all other flat product categories rose on September, 2020, with cut plate up 119%, cold rolled up 77%, and hot dip galvanized up 34%.
Flat products imports in the first nine months of 2021 were 48% higher than in the same period last year. Comparing 2021 to 2020, imports of hot rolled rose 85%, imports of cut plate increased 57%, imports of cold rolled rose 22% and imports of hot dip galvanized rose 21%.
US flat products imports licenses
January 2014 to September 2021
Short tons
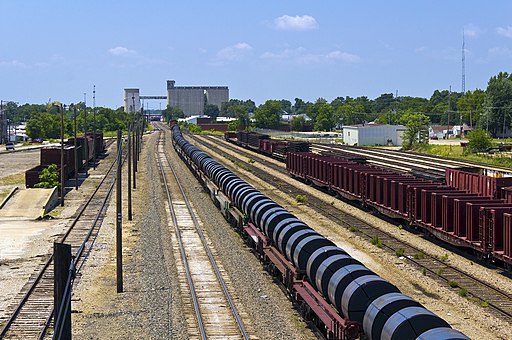
“A train carrying what seems to be an unlimited number of coils rolls into downtown Springfield, MO.” by Doug Wertman from Rogers, AR, USA, CC BY 2.0 https://creativecommons.org/licenses/by/2.0, via Wikimedia Commons
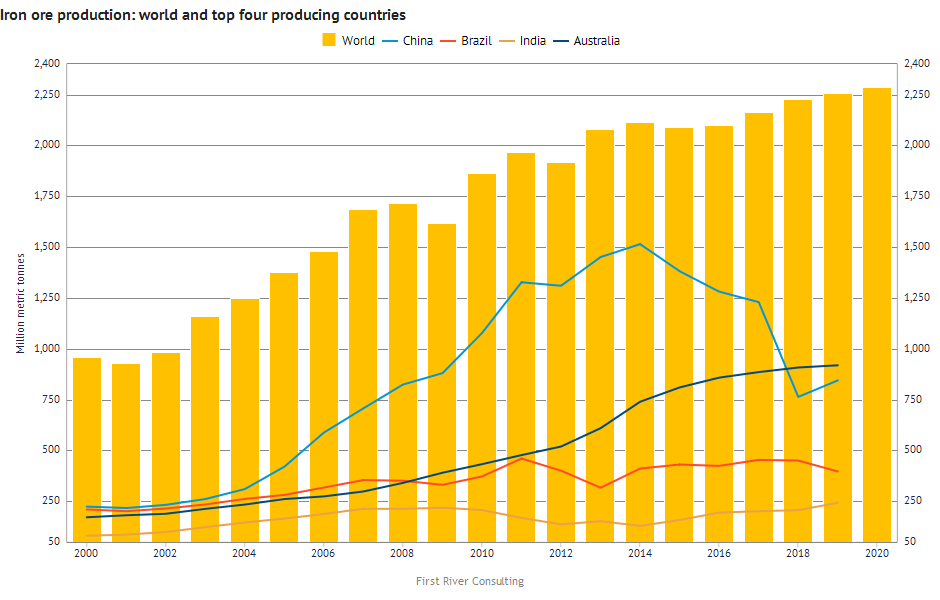
First River’s Steel Data Room has “tonnes” of data if you are looking for information on steelmaking raw materials. This week’s Nerds post focuses on two Steel Data Room datasets with world annual minerals production, consumption and trade data.
“Met Coal and Iron Ore Consumption, Trade, and Prices” has data from the Australian Government’s Department of Industry, Innovation, and Science. It includes world and Australian annual production/consumption/trade of iron ore and metallurgical coal by quality, in many cases from 1990.
“World Mineral Production from 1970” has data from the British Geological Survey. It includes country-specific annual production of minerals, cement, and ferro-alloys, but most importantly for steelmakers, iron ore, coal and zinc.
In the Steel Data Room, you can easily create charts to export into your presentations which combine data from different sources. The chart below shows world iron ore production from the Australian Government’s Department of Industry together with the iron ore production by country from the British Geological Survey. The chart automatically updates when the new data is published (the 2020 production data by country will be available in spring, 2022).
Interested in taking a closer look at what’s available in the Steel Data Room? Try a free trial.
Worldsteel reported crude steel production in China at 83.2 million metric tonnes in August, 13.2% lower than in August, 2020. Chinese crude steel production in the first eight months of 2020 was 3.9% higher than in the same period last year.
Data from China’s General Administration of Customs show net finished steel exports (exports minus imports) in August at 4.0 million tonnes, 178% higher than in August, 2020. Net finished steel exports in the first eight months of 2021 were 59% higher than in the first eight months of 2020.