Worldsteel reported crude steel production in China at 97.9 million metric tonnes in April, 13% higher than in April 2020. Chinese crude steel production in the first four months of 2021 was 13% higher than in the same period last year.
Data from China’s General Administration of Customs show net finished steel exports in April at 6.8 million tonnes, 28% higher than in April 2020. Net finished steel exports in the first four months of 2021 were 26% higher than in the first four months of 2020.
China Monthly Crude Steel Production, 2006 to 2021
China produced 97.9 million tonnes in April, accounting for 58% of world output and rising 13% on April 2020. In other parts of Asia, Indian output rose 152%, Japanese production increased 19%, and South Korean production rose 15%.
European Union (27) crude steel output rose 43% on last April following a 32% rise in Germany and a 79% increase in Italy (Italian source Federacciai). North American production rose 38% with US output up 43%. Other significant changes compared to April 2020 include a 47% increase in Turkey and a 59% increase in Brazil.
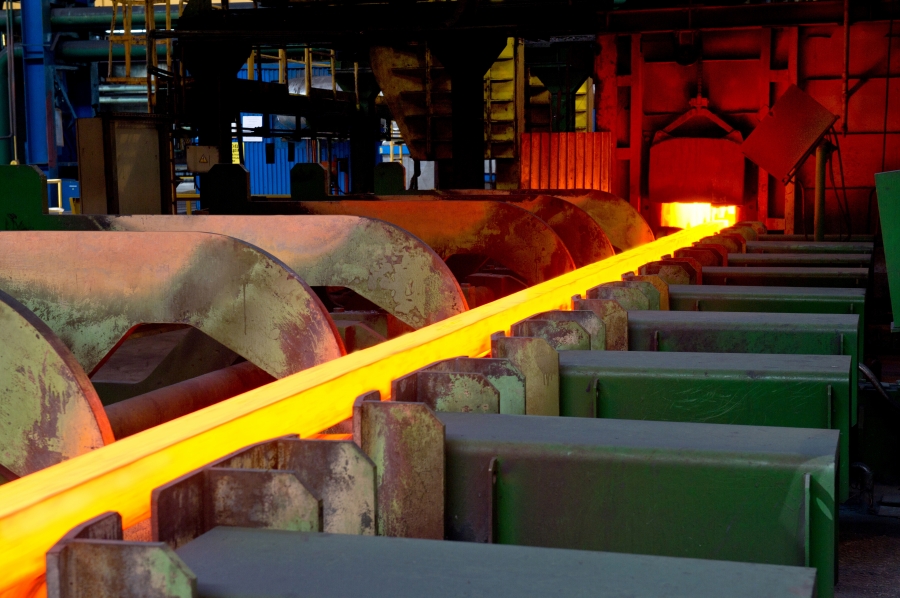
Billet production at NSMMZ (NLMK Group) from the Worldsteel Image Library by worldsteel / Georgy Rozov
Based on reported import licenses, US long products imports rose 10% from 258,000 short tons in April 2020 to 284,000 tons last month. Licenses indicate import volumes rising for all long products categories except rebar, where imports declined by 1%.
US long products imports in the first four months of 2021 were 10% higher than in the same period last year with the largest increase coming from rebar, where volumes rose mainly from Canada and Turkey. All other structural shapes and light shapes imports also rose significantly year-on-year.
US long products import licenses from ITA Steel Import Monitor
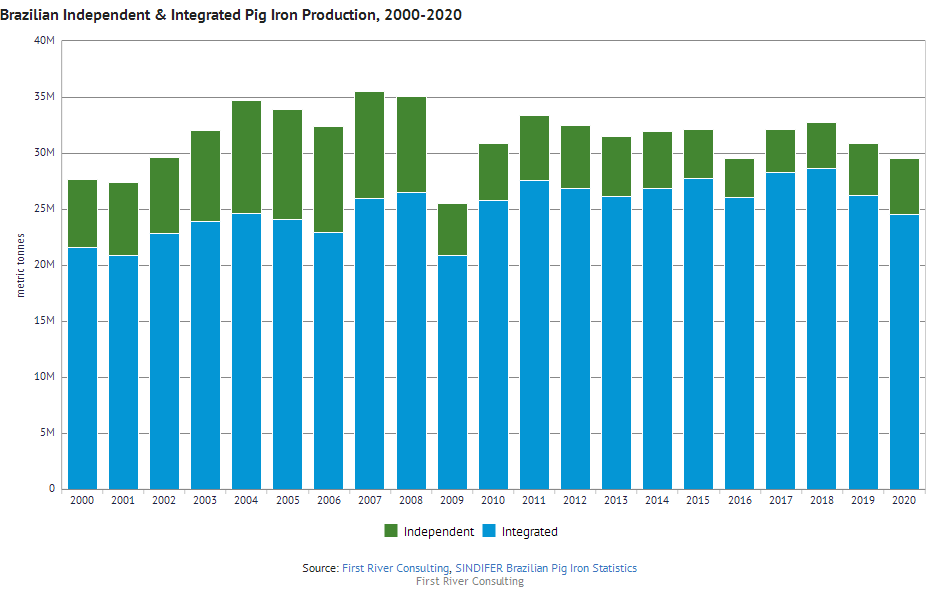
Another great source of information on steelmaking raw materials is the Steel Data Room’s dataset “SINDIFER Brazilian Pig Iron Statistics”. This dataset contains annual Brazilian pig iron production, sales, and export volumes back to 2000 from SINDIFER, the Union of Pig Iron Producers in the State of Minas Gerais.
One of the things you can do with this dataset is to chart production by independent and integrated producers. As you can see below, Brazilian pig iron production in 2020 was 29.5 million metric tonnes, 5Mt or 17% of which came from independent producers. If you want to dig into the details, you can find data for Minas Gerais state only, data on charcoal or coke-based pig iron production, and domestic and export sales volumes.
Based on reported import licenses, US flat products imports rose 47% from 468,000 short tons in April 2020 to 687,000 tonnes last month. The highest volume increase came from hot roll where volumes rose mainly from Canada, but also from Japan. Hot dip galvanized imports also rose significantly due to higher volumes from Canada and Mexico.
Flat products imports in the first four months of 2021 were 12% higher than in the same period last year. Imports of cut plate rose 49%, imports of hot rolled increased 27%, and imports of hot dip galvanized rose 1%. In contrast, cold rolled imports fell 10%.
Steel Imports Monitor US Flat Products Import Licenses
The hot topic of the day in the steel industry is steelmaking raw materials, and this week’s featured dataset focuses on DRI, one of the key steelmaking materials for the future production of sustainable steel.
The dataset “Midrex World Direct Reduction Statistics” has all the statistics publicly available from Midrex‘s World Direct Reduction Statistics report. This includes production by product (CDRI, HBI, HDRI), by shaft furnace producer (MIDREX, Other), and by process (MIDREX, HYL/Energiron, PERED, Other, Rotary Kiln), together with DRI shipments by product (CDRI, HBI) and transport means (Water, Land).
In addition, the dataset includes DRI production by country since 1990. In the chart below, you can see the steep increase in Indian and Iranian DRI production over the last 10 years.