Worldsteel reported crude steel production in China at 94 million metric tonnes in March, 19% higher than in March 2020. Chinese crude steel output in the first quarter of 2021 was 12% higher than in the same period last year.
Data from China’s General Administration of Customs show net finished steel exports in March at 6.2 million tonnes, 17% higher than in March 2020. Net finished steel exports in the first quarter of 2021 were 26% higher than in the first quarter of 2020.
China Monthly Crude Steel Production, 2006 to 2021
China produced 94 million tonnes in March, accounting for 56% of world output and rising 19% on March 2020. In other parts of Asia, Indian output rose 24%, while Japanese and South Korean production both increased 5%.
European Union (27) crude steel output rose 17.5% on last March following a 10% rise in Germany and a 69% increase in Italy (Italian source Federacciai). North American production rose 0.1% with US output up 1%. Other significant changes compared to March, 2020 include a 9% increase in Turkey and Russia, as well as an 11% production rise in Iran.
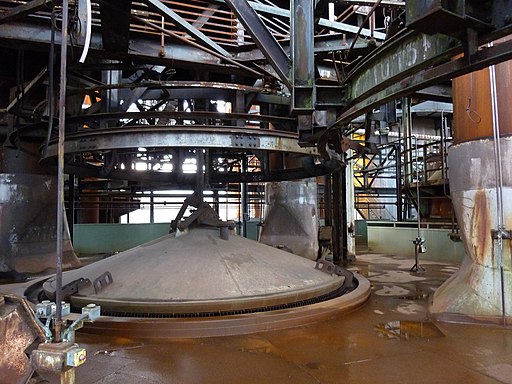
Upper bell Blast furnace Völklingen Ironworks, 2012, by Borvan53, CC0, via Wikimedia Commons
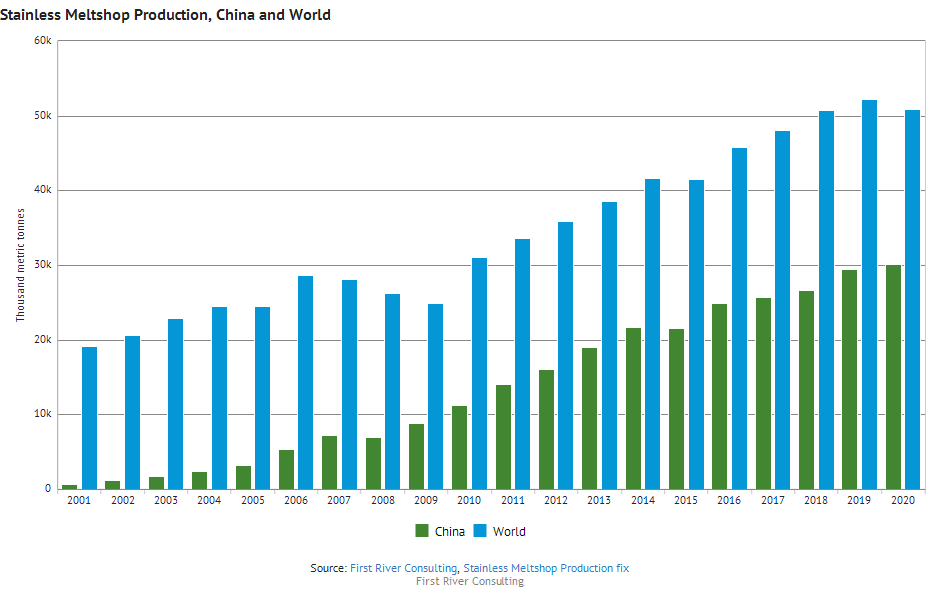
Did you know that stainless steel meltshop production worldwide in 2020 was 50.9 million metric tonnes, a 2.5% drop from 2019 levels? Did you know that world stainless meltshop production grew annually by 5% on average between 2001 and 2020? You can find all this data in this week’s featured dataset, Stainless Meltshop Production.
Stainless Meltshop Production figures come from the International Steel Stainless Forum (ISSF) and include stainless meltshop production (slab/ingot equivalent) quarterly and annually from 2001 worldwide and in specific regions and countries. You can easily create exceptional charts like the one below, which illustrates how China’s share of world stainless production has risen from 4% in 2001 to 59% in 2020.
If you’d like to see what other great steel industry data is available in the Steel Data Room, try a free Steel Data Room trial.
Based on reported import licenses, US long products imports rose 29% from 219,000 short tons in March 2020 to 282,000 tons last month. Licenses indicate that the increase was mainly due to higher rebar imports which rose significantly from Algeria, Portugal, and Turkey.
US long products imports in the the first 3 months of 2021 were 6% higher than in the same period last year with the largest increases coming from rebar and all other structural sections imports.
US long products import licenses from ITA Steel Import Monitor
January 2015 to March 2021
Short tons
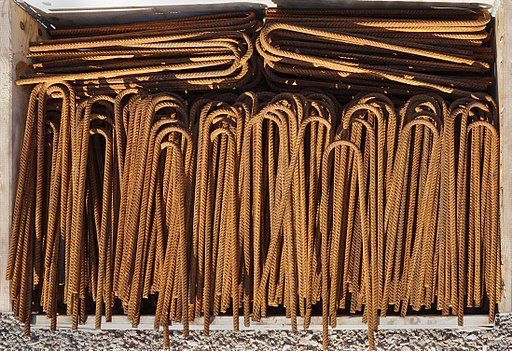
A crate of bent and somewhat rusty rebar at construction site in Rixö old quarry, Lysekil, Sweden by W.carter, CC BY-SA 4.0 https://creativecommons.org/licenses/by-sa/4.0, via Wikimedia Commons
In its latest Short Range Outlook (SRO), published yesterday, Worldsteel expects steel demand in 2021 to reach 1,874 million metric tonnes. The new forecast increases estimated demand growth between 2020 and 2021 from +4.1% in its October 2020 SRO to +5.8% in the newly released figures.
China accounted for 56% of world steel demand in 2020 and is expected to account for 55% of world demand in 2021 and 54% in 2022. Chinese steel demand is predicted to rise by 3% in 2021 and 1% in 2022.
After an 10% decline in steel demand in 2020, steel demand outside of China is expected to rise by 9.3% in 2021 and 4.7% in 2022. Asia and Oceania demand outside China is forecast to rise by 10.2% in 2021 and by 5.1% in 2022. European Union plus UK demand is expected to rise by 10.2% in 2021 and by 4.8% in 2022. And finally, USMCA (former NAFTA) demand is predicted to rise by 7.6% in 2021 and by 4.6% in 2022.
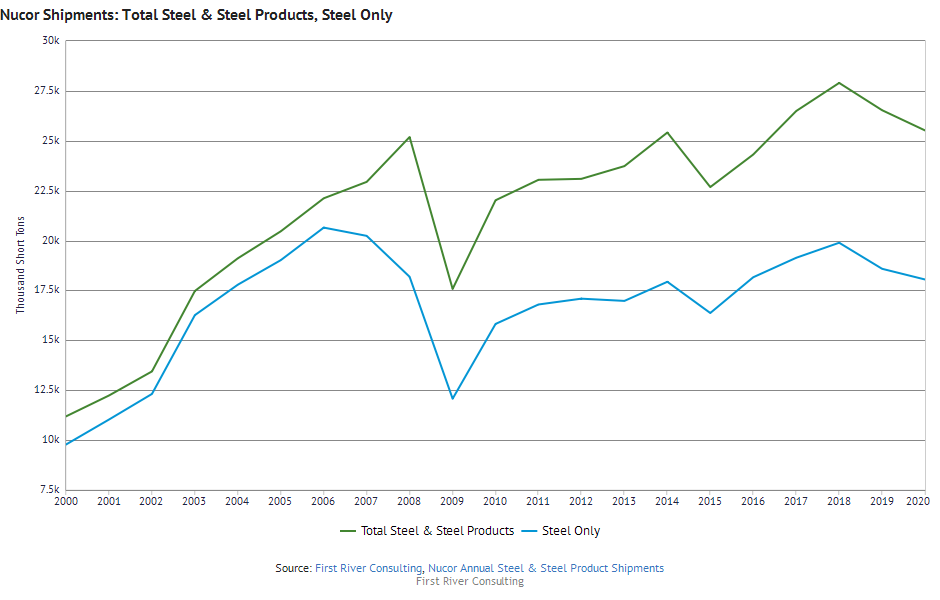
If you are looking to chart publicly available steel shipments data for major US steelmakers, you’ll be interested in this week’s Steel Data Room featured dataset “Nucor Annual Steel & Steel Product Shipments”. This dataset has all Nucor’s annual steel shipments data by steel product and downstream product. However, while Nucor has data easily available back to 2016 online, First River has painstakingly gathered a long historical data series.
You can see how Nucor’s steel and steel product shipments have grown since 2000 in the chart below. Interestingly, much of their shipments growth over this period came from downstream steel products, rather than steel production itself.
If you are interested in this dataset, you might want to check out another dataset, “Steel Dynamics Shipments”. To see both, all you need to do is to register for a free Steel Data Room Trial.