If you are looking to chart publicly available steel shipments data for major US steelmakers, you’ll be interested in this week’s Steel Data Room featured dataset “Nucor Annual Steel & Steel Product Shipments”. This dataset has all Nucor’s annual steel shipments data by steel product and downstream product. However, while Nucor has data easily available back to 2016 online, First River has painstakingly gathered a long historical data series.
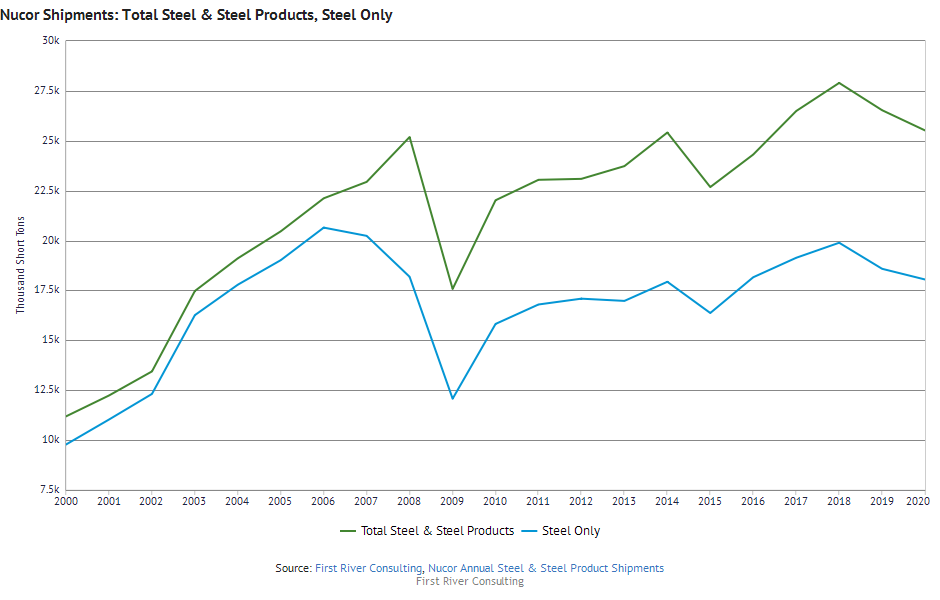
You can see how Nucor’s steel and steel product shipments have grown since 2000 in the chart below. Interestingly, much of their shipments growth over this period came from downstream steel products, rather than steel production itself.
If you are interested in this dataset, you might want to check out another dataset, “Steel Dynamics Shipments”. To see both, all you need to do is to register for a free Steel Data Room Trial.
Based on reported import licenses, US flat products imports rose 32% from 562,000 short tons in March 2020 to 741,000 tons last month. The highest volume increase came from hot rolled where volumes rose mainly from South Korea and Canada. Hot dip galvanized imports also rose significantly due to higher volumes from Taiwan, Canada and South Africa.
Flat products imports in the first quarter of 2021 were 4% higher than in the same period last year. Imports of cut plate and hot rolled rose (33% and 19% respectively), but were offset by declines from cold rolled (-7%) and hot dip galvanized (-10%).
Steel Import Monitor US Flat Products Import Licenses
If you are following the US steel industry, you’ll be interested in this week’s featured dataset, “AISI Capacity Utilization”. This dataset has figures published weekly by the American Iron and Steel Association including raw steelmaking capacity utilization and production.
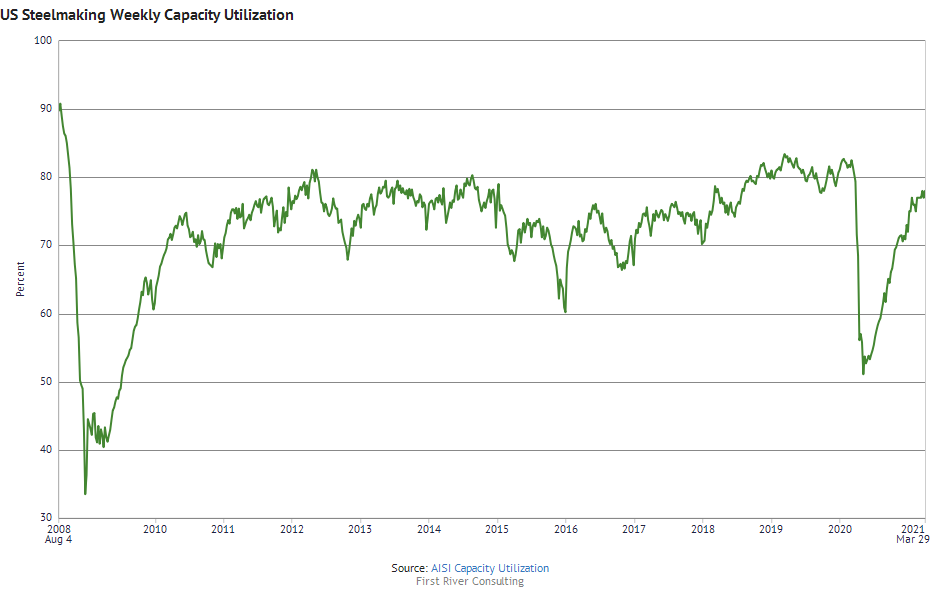
In the graph below showing capacity utilization since 2008, you can see the effects of the 2008 financial crisis and the Covid crisis. Charts like this one are exceptionally easy to make and in the Steel Data Room, charts get automatically updated when AISI publishes its data every Monday.
China produced 83 million tonnes in February, accounting for 55% of world output and rising 10.9% on February 2020. In other parts of Asia, Indian production fell 3.1%, Japanese production dropped 5.6%, but South Korean output rose 1.2%.
European Union production fell 7.1% on last February following a 10.4% drop in Germany. North American production fell 8.9% with US output down 10.9%. Other significant changes compared to February, 2020 include an 11.5% increase in Iran and a 5.9% rise in Turkey.
Based on reported import licenses, US long products imports fell 3% from 241,000 short tons in February 2020 to 234,000 tons last month. Licenses indicate that the decline was mainly due to lower parallel flange sections imports which dropped significantly from Luxembourg.
US long products imports over the first two months of 2021 were also 3% lower than in the same period last year with the largest volume declines coming from wire rod and parallel flange sections.
US long products import licenses from ITA Steel Import Monitor
Based on reported import licenses, US flat products imports rose 17% from 555,000 short tons in February 2020 to 647,000 tons last month.
The highest volume increase came from hot roll where import volumes were up from Japan, South Korea, and Turkey. Cold rolled imports also rose significantly due to higher volumes from Australia, the UK, and Germany.
Steel Import Monitor US Flat Products Import Licenses
January 2014 to February 2021
Short tons
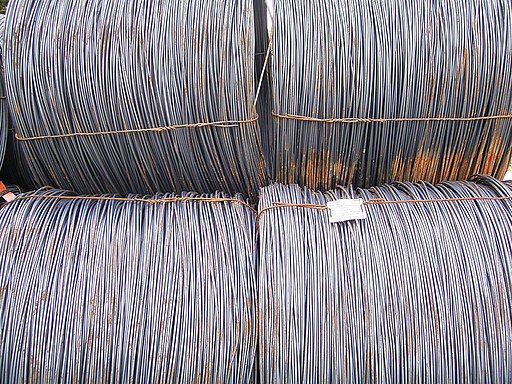
“Gdańsk – steel coils in Nowy Port harbour”, 2013, from Andrzej Otrębski, CC BY-SA 3.0 https://creativecommons.org/licenses/by-sa/3.0, via Wikimedia Commons