Worldsteel reported crude steel production in China at 87.7 million metric tonnes in November, 8% higher than in November 2019. Chinese production in the first eleven months of 2020 was 6% higher than in the same period last year.
Data from the General Administration of Customs show net finished steel exports (exports minus imports) in November were 2.5 million tonnes, down 28% on November 2019. Net exports in the first eleven months of 2020 were 39% lower than in the same period last year.
China monthly crude steel production
Thousand metric tonnes
“China Steel Responsibility” bulk carrier just out of the IJmuiden lock, sailing towards Amsterdam, Port of Amsterdam, The Netherlands by AlfvanBeem, CC0, via Wikimedia Commons
Worldsteel published November 2020 world crude steel production yesterday. World steel output was 158.3 million metric tonnes, 6.6% higher than in November 2019. Crude steel production in the first ten months of 2020 was 1.1% lower than in the same period last year.
China accounted for 55% of world output in November. Chinese production was 87.7 million tonnes, 8.0% higher than in November 2019. Non-China Asian output rose 9.2% on last November due to a 166.7% rise in Vietnam and despite a 5.9% drop in Japan.
European Union plus the UK output rose 5.5% on November 2019 following a 14.8% rise in Germany. In North America, US production fell 13.7%. Other significant changes compared to last November include increased output in Brazil (11.2%), Turkey (+11.6%), Ukraine (+30.8%), and Iran (+14.1%).
Based on reported import licenses, US long products imports rose 35% from 172,000 short tons in November 2019 to 232,000 tons in November this year. Licenses indicate that the increase was mainly due to higher rebar imports from Turkey, Portugal, and Spain.
Based on January to October imports and November import licenses, US long products imports in the first eleven months of 2020 were 15% lower than in the same period last year with the largest import volume declines coming from wire rod (-31%) and parallel flange sections (-39%).
US long products import licenses from ITA Steel Import Monitor
January 2014 to November 2020
Short tons
Rebar reinforcements for the stairs at the 47th Street exit from the new LIRR Concourse. (CM14B, 05-01-2019) by MTA Capital Construction Mega Projects, CC BY 2.0 https://creativecommons.org/licenses/by/2.0, via Wikimedia Commons
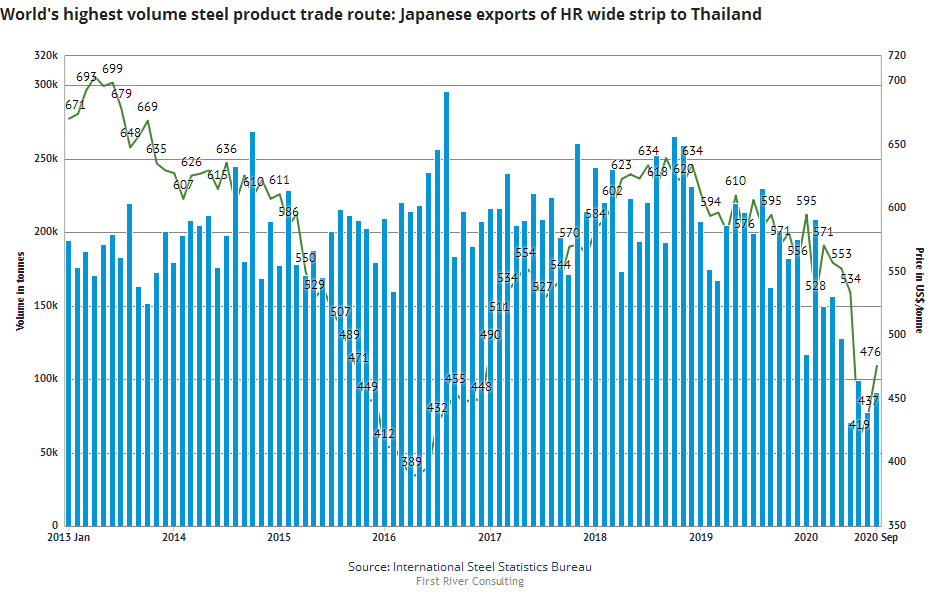
What is the world’s highest volume finished steel product trade route? The answer can be found in this week’s dataset of the week, “Global Carbon & Alloy Steel Products Imports and Exports”. The data comes from the International Steel Statistics Bureau (ISSB) and includes monthly import and export data by country from 2013 in value and quantity.
And the answer is… Japanese exports of hot rolled wide strip to Thailand. Japanese total exports of hot rolled wide strip to all countries far outmeasure exports of other single products from other countries. However, it was a close call between Japanese exports of hot rolled wide strip to Thailand or to South Korea over the last eight years. Despite Thailand’s 2020 dropoff in HR wide strip imports, volumes on average over the last eight years (2020 to September) from Japan to Thailand (2.297Mt) were higher than to South Korea (2.288Mt).
In the Steel Data Room, you can easily create charts like the one below, which shows monthly volumes of Japanese exports to Thailand (blue), together with average prices (green). Interested in taking a look? Try our free Steel Data Room trial.
Based on reported import licenses, US flat products imports fell 10% from 514,000 short tons in November 2019 to 461,000 tons last month. Cold rolled imports declined by the largest volume, down 26% on last November, due mainly to lower volumes from Canada, Mexico and Vietnam. Cut plate imports fell by the second largest volume, down 42%.
Based on January to October imports and November import licenses, US flat products imports in the first eleven months of 2020 were 20% lower than in the same period last year with cut plate imports -42%, hot roll -20%, cold roll -24%, and hot dip galvanized -11%.
Steel Import Monitor US flat products import licenses
January 2014 to November 2020
Short tons
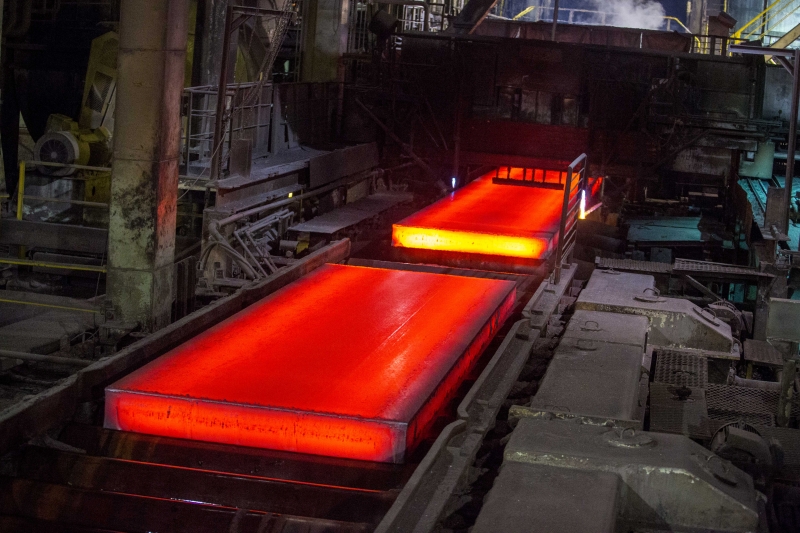
Red hot steel plate being rolled at POSCO Pohang Steelworks from Worldsteel Image Library by worldsteel / Seong Joon Cho
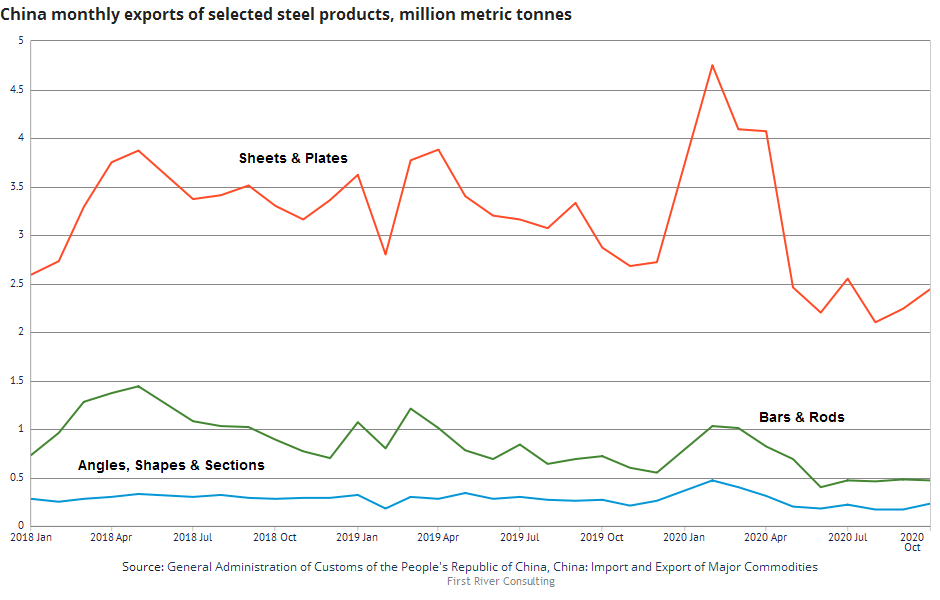
If you are looking for Chinese data on steel trade, you might want to check out the Dataset of the Week “China Import and Export of Major Commodities”. The information is published by the General Administration of Customs of the People’s Republic of China and contains monthly imports and exports of all major commodities in quantity and value. As you can see in the chart below, the dataset includes specific finished steel products, but also steelmaking raw materials such as coking coal, iron ore and ferrous scrap.
Don’t forget that in the Steel Data Room, the charts and dashboards you create are automatically updated when the newest data is available. China’s General Administration of Customs just released the November data and the chart below will update itself on Wednesday.