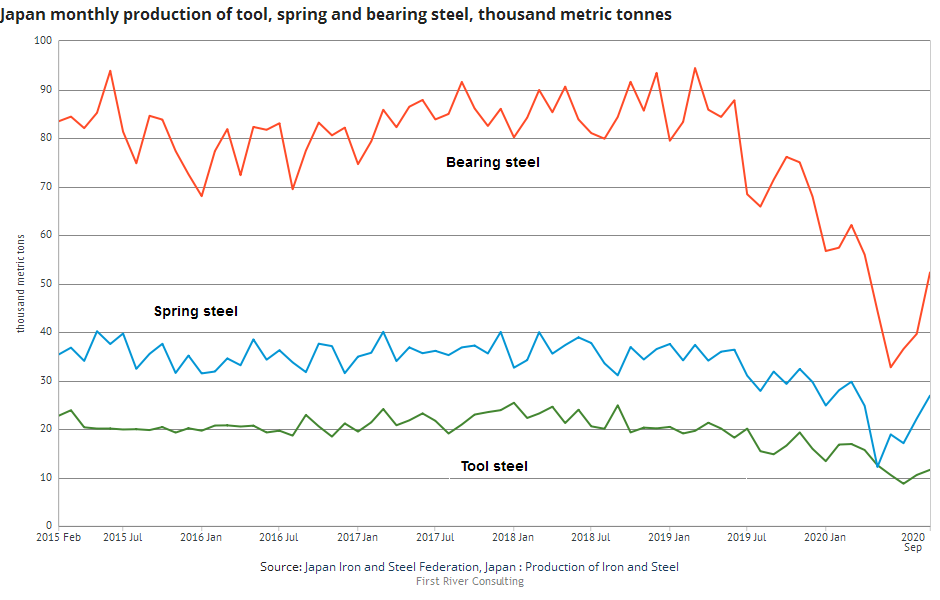
Looking to build charts with steel industry data directly from country steel industry associations? Often steel industry associations such as the Japan Iron & Steel Federation publish more detailed data than what’s available through Worldsteel. This week’s highlighted dataset is the perfect example. “Japan Production of Iron & Steel” includes annual, quarterly and monthly steel production data in detailed product categories such as tool steel, spring steel, and bearing steel, as you can see in chart below.
Worldsteel reported crude steel production in China at 92.2 million metric tonnes in October, 12.7% higher than in October 2019. Chinese production in the first ten months of 2020 was 5.5% higher than in the same period last year.
Data from the General Administration of Customs show net finished steel exports (exports minus imports) in October were 2.1 million tonnes, down 43.9% on October 2019. Net exports in the first ten months of 2020 were 39.5% lower than in the same period last year.
China monthly crude steel production
Thousand metric tonnes
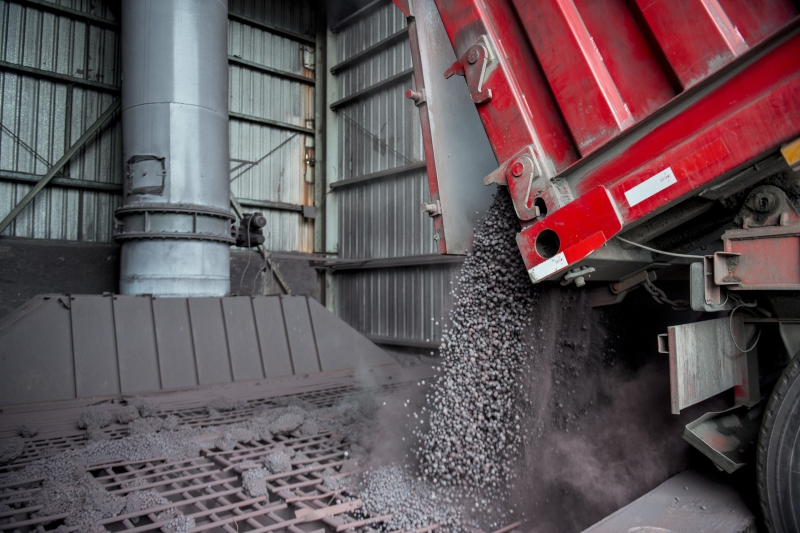
Unloading iron ore pellets at HBIS Tangsteel from Worldsteel Image Library by worldsteel / Shawn Koh
Worldsteel published October 2020 world crude steel production yesterday. World steel output was 161.9 million metric tonnes, 7.0% higher than in October 2019. Crude steel production in the first ten months of 2020 was 2.0% lower than in the same period last year.
China accounted for 57% of world output in October. Chinese production was 92.2 million tonnes, 12.7% higher than in October 2019. Asian output outside of China rose 3.3% on last October, mainly due to a 111.5% increase in Vietnam and despite a 11.7% drop in Japan.
European Union plus the UK crude steel production fell 5.6% on last October. In North America, US production was down 15.3%, Canadian output fell 17.5%, but Mexican production was up 1.1%. Other significant changes around the work include increased production in Turkey (+19.4%), Russia (+4.3%), and Iran (+27.9%).
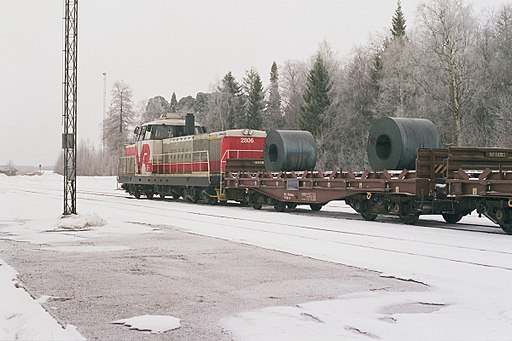
A VR-operated Dr16 class diesel locomotive with freight wagons at the railway station of Tornio in Finland, by Methem (Mikko J. Putkonen), CC BY 3.0 https://creativecommons.org/licenses/by/3.0, via Wikimedia Commons
Based on reported import licenses, US long products imports fell 3% from 233,000 short tons in October 2019 to 226,000 tons in October this year. Licenses indicate that the decline was mainly due to lower wire rod imports from Japan and Canada.
Based on January to September imports and October import licenses, US long products imports so far this year were 19% lower than in the same period last year with the largest import volume declines coming from wire rod (-33%) and parallel flange sections (-41%).
US long products import licenses from ITA Steel Import Monitor
January 2014 to October 2020
Short tons
Steel wire rope on a winch drum, by W.carter, CC0, via Wikimedia Commons
Based on reported import licenses, US flat products imports fell 15% from 616,000 short tons in October 2019 to 526,000 tons last month. Hot rolled imports declined by the largest volume, down 21% on last October, due mainly to lower volumes from Canada and South Korea. Hot dip galvanized imports fell by the second largest volume, down 15%.
Based on January to September imports and October import licenses, US flat products imports in the first ten months of 2020 were 20% lower than in the same period last year with cut plate imports -40%, hot rolled -21%, cold rolled -24%, and hot dip galvanized -12%.
Steel Import Monitor US flat products import licenses
January 2014 to October 2020
Short tons
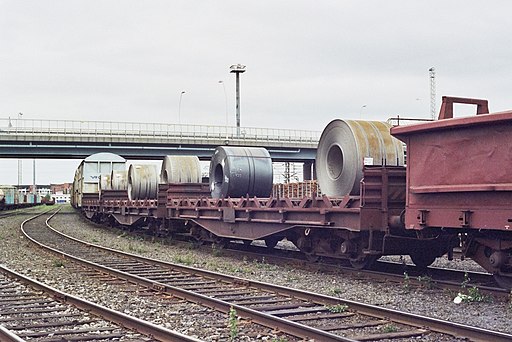
Rolled steel coils (possibly by Rautaruukki) in the VR freight yard at the city of Oulu in Finland, June 2009, by Methem (Mikko J. Putkonen), CC BY 3.0 https://creativecommons.org/licenses/by/3.0, via Wikimedia Commons
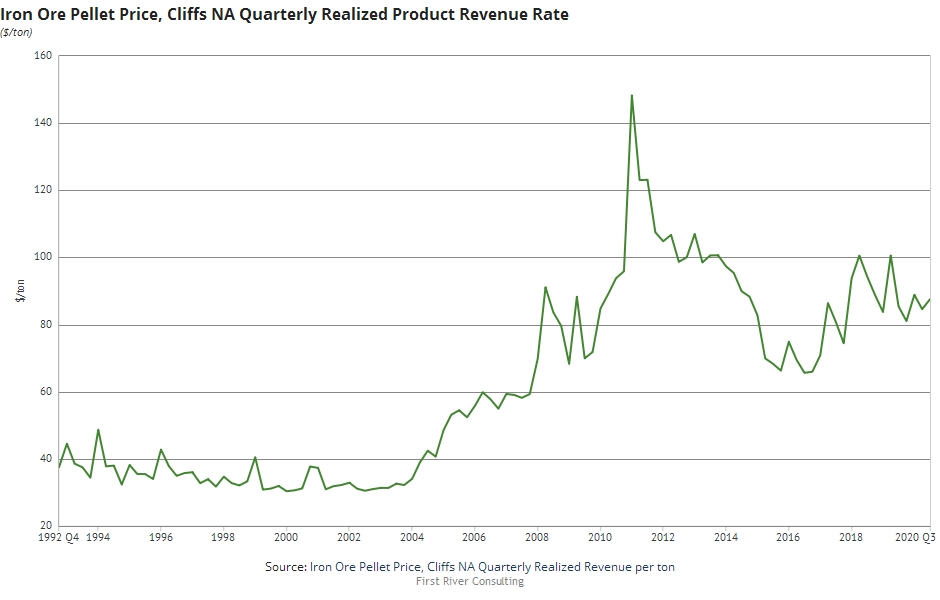
Following iron ore pellet prices? You may be interested in this week’s Steel Data Room featured dataset “Iron Ore Pellet Price, Cliffs NA Quarterly Realized Product Revenue Rate”.
In this dataset, you can find Cleveland-Cliffs‘ quarterly realized product revenue rate for their Mining and Pelletizing business from Q4 1992 to their latest Q3 2020 data released last Friday. This is the equivalent to a North American pellet price, which we at First River use for our North American steelmaking cost models.
Try a free Steel Data Room trial to see all the steel-related data available which will make your charting and modeling easy.