Worldsteel reported crude steel production in China at 92.6 million metric tonnes in September, 10.9% higher than in September 2019. Chinese production in the first nine months of 2020 was 4.7% higher than in the same period last year.
Data from the General Administration of Customs show Chinese net finished steel exports (exports minus imports) in September were 0.9 million tonnes, down 77.6% on September 2019. Net exports in the first nine months of 2020 were 39.1% lower than in the same period last year.
China monthly crude steel production
Thousand metric tonnes
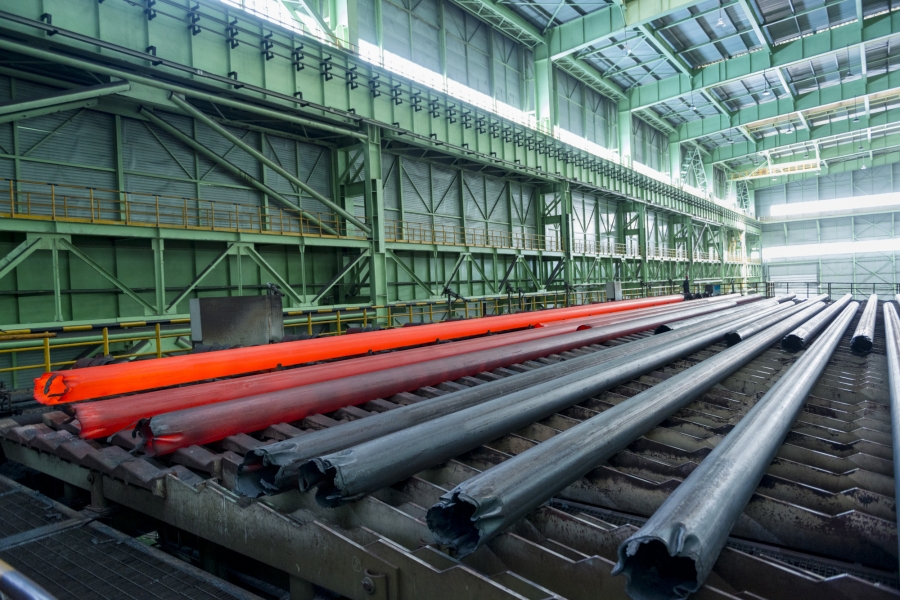
Seamless steel pipes on cooling bed at Baotou Iron & Steel from Worldsteel Image Library by worldsteel / Shawn Koh
Worldsteel published September 2020 world crude steel production today. World steel output was 156.4 million metric tonnes, 2.9% higher than in September 2019. Crude steel production in the first nine months of 2020 was 3.1% lower than in the same period last year.
China accounted for 59% of world output in September. Chinese production was 92.6 million tonnes, 10.9% higher than in September 2019. Asian output outside of China fell 3.8%, mainly due to a 19.3% drop in Japan.
European Union crude steel production fell 14.0% on last September on declines in Italy (-18.7%), Germany (-9.7%), Spain (-20.7%) and France (-20.1%). In North America, US production was down 18.5% while Canadian output fell 27.6% and Mexican output fell 3.9%. Other increases to note include Turkey (+18.0%) and Vietnam (+45.3%).
This week’s Steel Data Room dataset of the week is for you steelnerds following investments in steelmaking technologies to reduce CO2 emissions. The dataset “Greenhouse Gas Emissions by Source Sector” includes emissions data published by the European statistics authority Eurostat and sourced from the European Environment Agency (EEA).
Here you can find data on emissions of ten different greenhouse gases by European country and by industry, with industries including iron and steel production, aluminum production, and many others. Data goes back to 1990 and importantly includes Turkey.
Interested in taking a closer look (especially to understand the details defining gases and consuming industries )? Take a look with a free Steel Data Room trial.
Based on reported import licenses, now available on the new ITA Steel Import Monitor website, US long products imports fell 15% from 214,000 short tons in September 2019 to 181,000 tons in September this year. Licenses indicate that the decline was mainly due to lower rebar imports from Algeria, Spain, and Turkey.
Based on January to August imports and September import licenses, long products imports so far this year were 19% lower than in the same period last year with the largest import volume declines coming from wire rod (-34%) and parallel flange sections (-45%).
ITA Steel Import Monitor US long products import licenses
In its latest Short Range Outlook (SRO), published yesterday, Worldsteel revised its steel demand growth forecast for 2020 upwards. The revision raised estimated demand growth between 2019 and 2020 from -6.4% in its June 2020 SRO to -2.4% in yesterday figures. Steel demand is expected to increase by 4.1% between 2020 and 2021.
China accounted for 51% of world steel demand in 2019 and is expected to account for 57% in 2020 and 55% in 2021. Chinese steel demand is forecast to rise by 8.0% in 2020 and 0% in 2021.
After a 1.4% decline in 2019, steel demand outside of China is expected to fall by 13.3% in 2020 and rise by 9.4% in 2021. Check out the downloadable spreadsheet below to see all the newest forecasts.
Freshly rolled steel in the hot rolling mill at POSCO Pohang Steelworks from Worldsteel Image Library by worldsteel / Seong Joon Cho
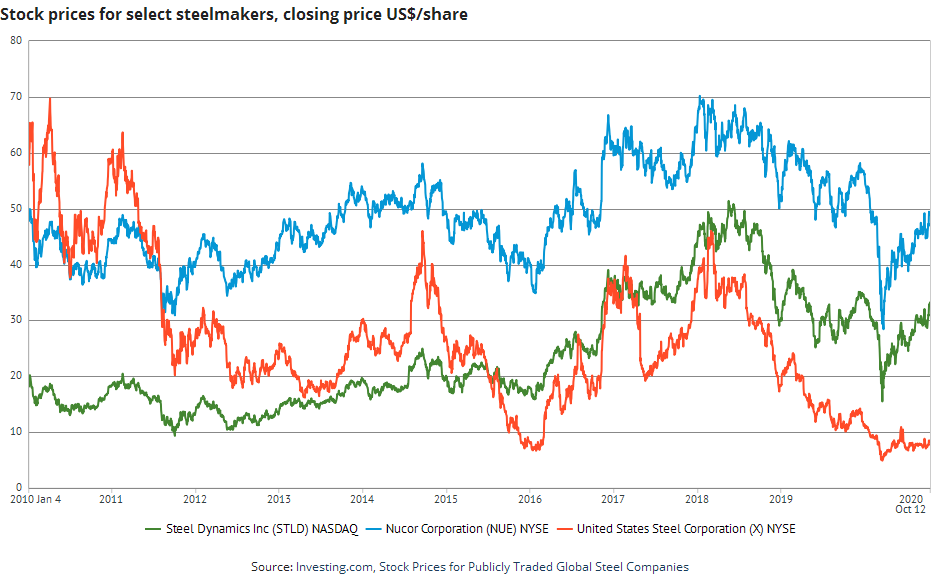
Looking to chart the share prices of steel companies worldwide to compare how they have performed over the last upturns and downturns? This week’s Steel Data Room’s dataset of the week, Stock Prices for Publicly Traded Global Steel Companies, has daily data from January 2010 to the present, all sourced from Investing.com.
You can look up over 500 publicly-listed companies in the steel industry, alphabetically from Acerinox to Zwahlen & Mayr, and you can sort by country or stock exchange. Finally, the dataset doesn’t just have close/open/high/low prices, but also percent price change and trading volumes.