Based on reported import licenses, US flat steel products imports fell 22% from 622,000 short tons in September 2019 to 482,000 tons last month. Hot rolled imports declined by the largest volume, down 25% on last September due mainly to lower volumes from Canada. Cold rolled imports dropped by the second largest volume, down 40% on last September, here mainly due to lower volumes from Canada, Australia, and Mexico.
Based on January to August imports and September import licenses, US flat products imports in the first nine months of 2020 were 21% lower than in the same period last year with cut plate imports -45%, hot rolled -23%, cold rolled -25% and hot dip galvanized -12%.
SIMA US flat products import licenses
January 2014 to September 2020
Short tons
“A closeup of a freight wagon hauled through Cardiff Central railway station by an EWS Class 66 diesel locomotive. The cargo looks to be slab steel, making it most likely to have come from the Port Talbot works. The Millennium Stadium is in the background”. Image from Wikimedia Commons by Chris McKenna (Thryduulf) / CC BY-SA (https://creativecommons.org/licenses/by-sa/4.0)
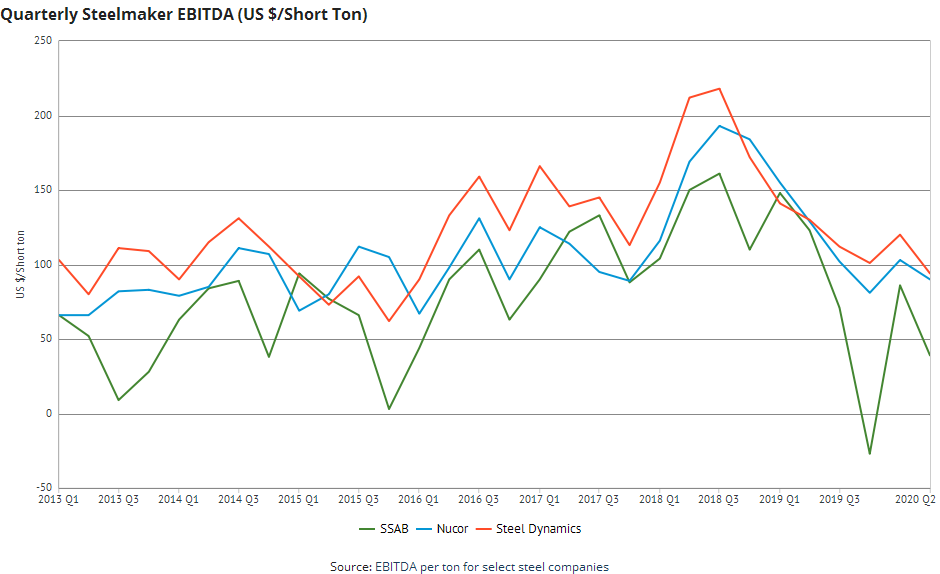
Last week’s dataset of the week highlighted publicly available steel industry data with the World Steel Association Steel Statistical Yearbook dataset. This week’s dataset, EBITDA per ton for select steelmakers, is an example of the wide variety of proprietary data held in the Steel Data Room.
This dataset contains First River calculations of EBITDA per ton of steel shipped for steelmakers who report operating and financial data. It has quarterly and annual data in US dollars per short ton from 2013 to the present, with numbers painstakingly checked to include EBITDA that applies to steel shipments.
Interested in seeing what other proprietary data the Steel Data Room has to offer? Try a free Steel Data Room trial.
Wouldn’t it be great to expertly chart publicly available data from the World Steel Association? In this week’s Steel Data Room dataset of the week, you steelnerds can find all the publicly available data from Worldsteel’s latest Steel Statistical Yearbook, as well historical data from past yearbooks back to 1980. And if you’re looking for other public Worldsteel data, the Steel Data Room has Short Range Outlooks, monthly world crude steel production, and Top steel-producing companies from World Steel in Figures.
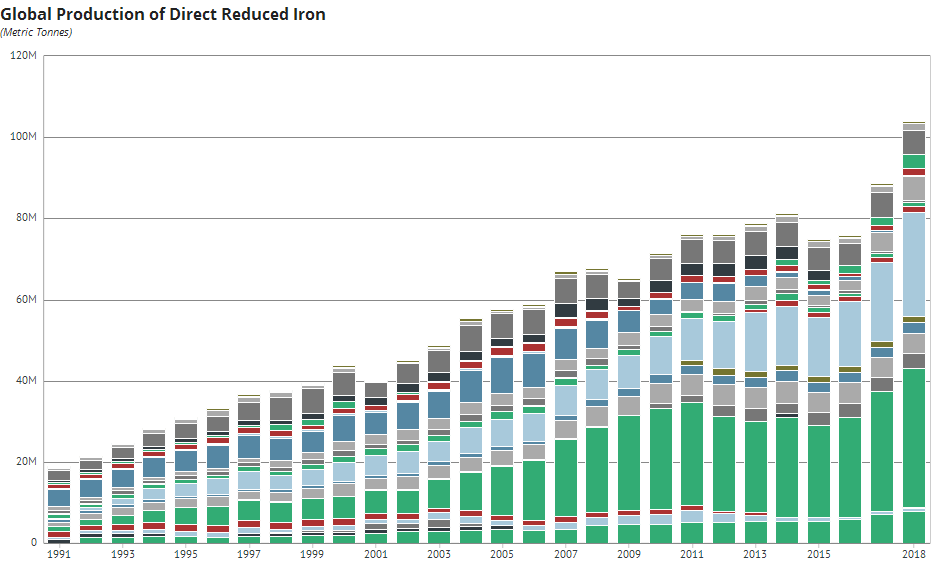
Not just Worldsteel. The Steel Data Room’s got publicly available data from a number of country and regional steel associations such as Acero Argentino, JISF, and Eurofer. If you sign up for a free Steel Data Room trial, you’ll be able to easily produce beautiful charts like the one below with Global Production of DRI, where hovering over the bars will allow you to see production by year by country.
Worldsteel reported crude steel production in China at 94.8 million metric tonnes in August, 8.4% higher than in August 2019. Chinese production in the first eight months of 2020 was 3.9% higher than in the same period last year.
Data from the General Administration of Customs show Chinese net finished steel exports (exports minus imports) in August were 1.4 million tonnes, down 64.3% on August 2019. Net exports in the first eight months of 2020 were 34.7% lower than in the same period last year.
China monthly crude steel production
Thousand metric tonnes
Construction site of New Qinghe Railway Station, China, 2019, from Wikimedia Commons by N509FZ / CC BY-SA (https://creativecommons.org/licenses/by-sa/4.0)
Worldsteel published August world crude steel production today. World steel output was 156.2 million metric tonnes, 0.6% higher than in August 2019. Crude steel production in the first eight months of 2020 was 4.1% lower than in the same period last year.
China accounted for 61% of world output in August. Chinese production was 94.8 million tonnes, 8.4% higher than in August 2019. Asian output outside of China fell 6.6%, mainly due to a 20.6% decline in Japan.
European Union crude steel production fell 16.6% on last August with the largest volume declines coming from Germany (-13.4%), Spain (-32.5%), and France (-31.2%). In North America, US output fell 24.4%, Canadian production fell 25.7%, and Mexican production dropped 17.3%. Other significant changes to note compared to last August include an increase in Turkey (+22.9%), a rise in Iran (+14.6%), a decline in Saudi Arabia (-52.3%), a decline in India (-4.4%), and an increase in Vietnam (+32.9%).
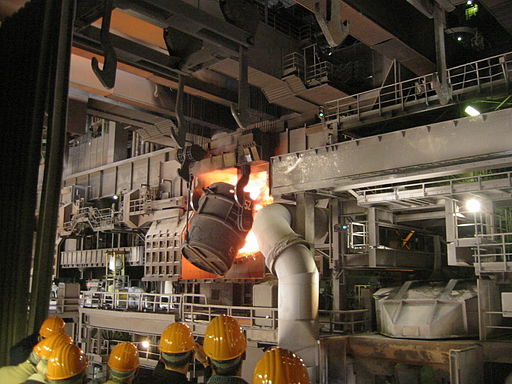
BOF at ThyssenKrupp Duisburg, 2009, from Wikimedia Commons by Katpatuka / CC BY-SA (http://creativecommons.org/licenses/by-sa/3.0/)
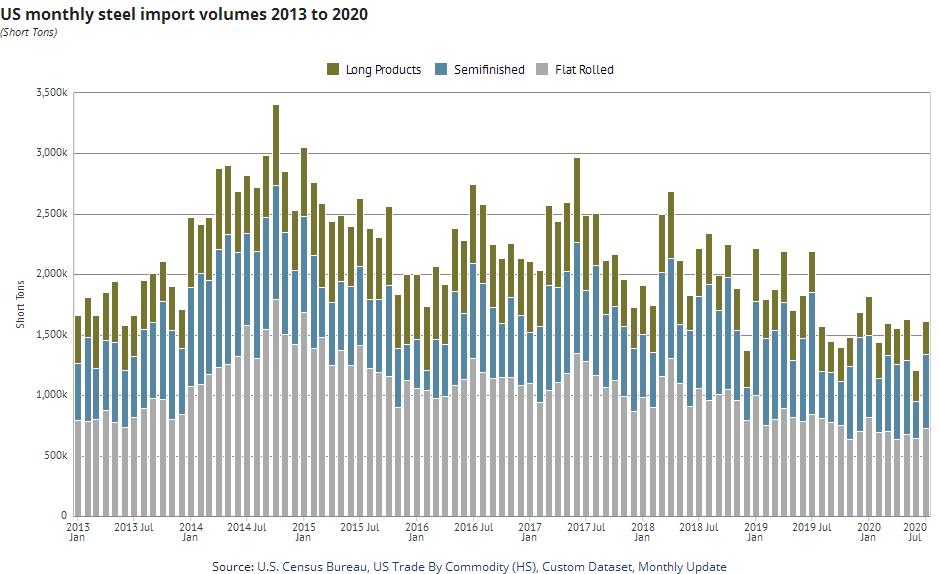
The U.S. Census Bureau trade data holds so much information that it is difficult to make sense of it. That’s why First River has organized the commodity codes into the major steel product categories and created this week’s Steel Data Room dataset of the week, “U.S. Trade by Commodity (HS), Custom Dataset, Monthly Update”.
Here’s where you can look up US exports and imports of all the major steel products from overall categories like flat rolled sheet to individual sub-categories like cold rolled electrogalvanized sheet. The data is available monthly in quantity and value, by trading partner country and even by US district.
Interested in taking a look? Try a free trial in the First River Steel Data Room.