Based on reported import licenses, US flat products imports rose 32% from 562,000 short tons in March 2020 to 741,000 tons last month. The highest volume increase came from hot rolled where volumes rose mainly from South Korea and Canada. Hot dip galvanized imports also rose significantly due to higher volumes from Taiwan, Canada and South Africa.
Flat products imports in the first quarter of 2021 were 4% higher than in the same period last year. Imports of cut plate and hot rolled rose (33% and 19% respectively), but were offset by declines from cold rolled (-7%) and hot dip galvanized (-10%).
Steel Import Monitor US Flat Products Import Licenses
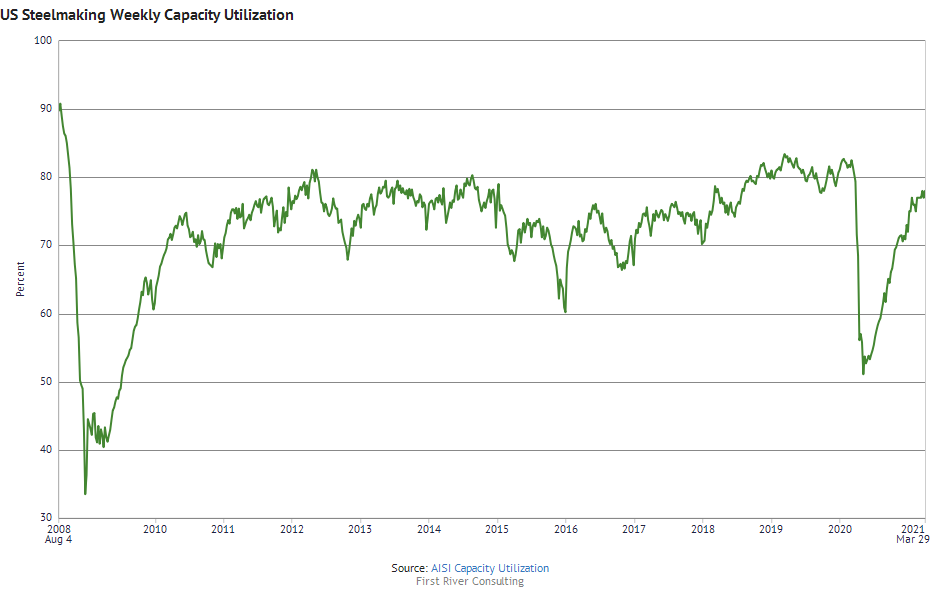
If you are following the US steel industry, you’ll be interested in this week’s featured dataset, “AISI Capacity Utilization”. This dataset has figures published weekly by the American Iron and Steel Association including raw steelmaking capacity utilization and production.
In the graph below showing capacity utilization since 2008, you can see the effects of the 2008 financial crisis and the Covid crisis. Charts like this one are exceptionally easy to make and in the Steel Data Room, charts get automatically updated when AISI publishes its data every Monday.
China produced 83 million tonnes in February, accounting for 55% of world output and rising 10.9% on February 2020. In other parts of Asia, Indian production fell 3.1%, Japanese production dropped 5.6%, but South Korean output rose 1.2%.
European Union production fell 7.1% on last February following a 10.4% drop in Germany. North American production fell 8.9% with US output down 10.9%. Other significant changes compared to February, 2020 include an 11.5% increase in Iran and a 5.9% rise in Turkey.
Based on reported import licenses, US long products imports fell 3% from 241,000 short tons in February 2020 to 234,000 tons last month. Licenses indicate that the decline was mainly due to lower parallel flange sections imports which dropped significantly from Luxembourg.
US long products imports over the first two months of 2021 were also 3% lower than in the same period last year with the largest volume declines coming from wire rod and parallel flange sections.
US long products import licenses from ITA Steel Import Monitor
Based on reported import licenses, US flat products imports rose 17% from 555,000 short tons in February 2020 to 647,000 tons last month.
The highest volume increase came from hot roll where import volumes were up from Japan, South Korea, and Turkey. Cold rolled imports also rose significantly due to higher volumes from Australia, the UK, and Germany.
Steel Import Monitor US Flat Products Import Licenses
January 2014 to February 2021
Short tons
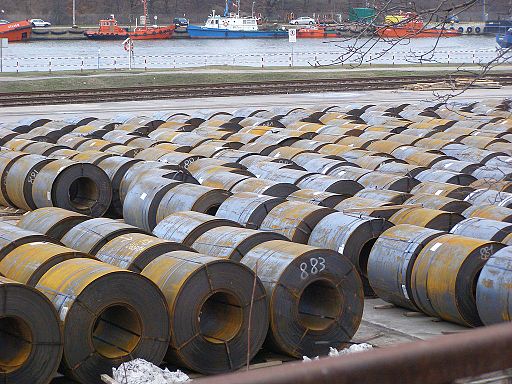
“Gdańsk – steel coils in Nowy Port harbour”, 2013, from Andrzej Otrębski, CC BY-SA 3.0 https://creativecommons.org/licenses/by-sa/3.0, via Wikimedia Commons
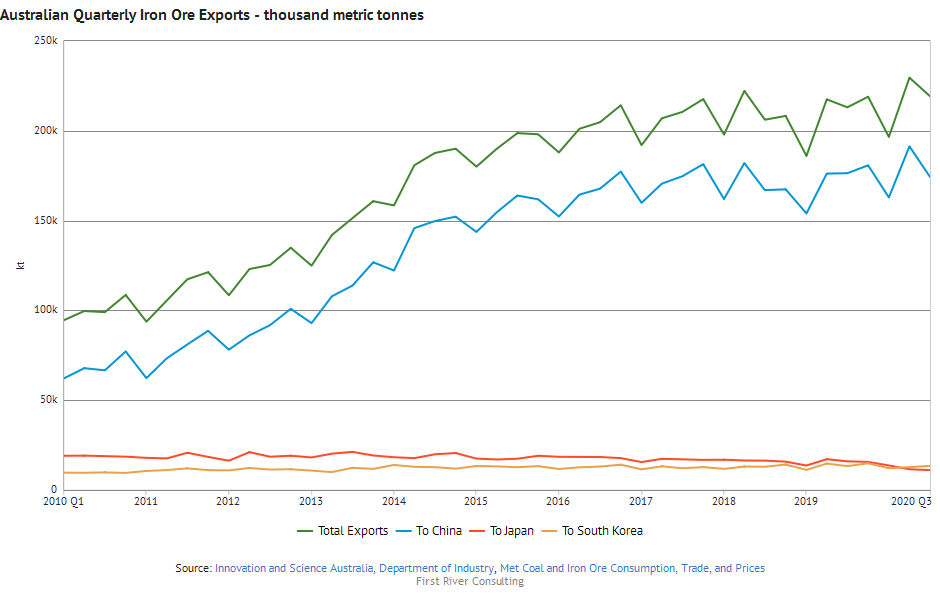
Did you know that Australian quarterly iron ore exports hit a historical peak of 225 million metric tonnes in Q2 2020 and that 191 million tonnes were exported to China? This and a whole lot more can be found in the Steel Data Room’s featured dataset, “Met Coal and Iron Ore Consumption, Trade, and Prices” with data from the Australian Government’s Department of Industry.
This dataset has world production, consumption, imports, and exports of metallurgical coal and iron ore, as well as more detailed information on Australian production and exports of coal and iron ore by quality and by major destination country.
In the chart below, you can see quarterly Australian exports of iron ore from Q1 2010 to Q3 2020, highlighting the increasing dominance of China compared to Japan and South Korea. This chart gets automatically updated with Q3 data when the Australian Government circulates it’s newest publication on March 23rd, another advantage of creating charts in the Steel Data Room.