Worldsteel published December 2020 and full-year 2020 world crude steel production today. World steel output was 160.9 million metric tonnes in December, 5.8% higher than in December 2019. Full-year 2020 steel production was 1,829.1 million tonnes, 0.9% lower than in full-year 2019.
China produced 1,053.0 million tonnes of crude steel in 2020, accounting for 58% of world output. China’s production rose 5.2% between 2019 and 2020 while production in the rest of the world fell 8.2%. Asian output outside of China showed a 11.0% production decline year-on-year with Japan -16.2%, India -10.6% and South Korea -6.0%.
Crude steel production in the European Union fell 11.8% compared to 2019 with the largest declines from Germany (-10.0%), Italy (-12.9%), France (-19.8%) and Spain (-19.5%). In North America, Canadian production dropped 14.1% and US output fell 17.2%.
Production between 2019 and 2020 increased, however, in Turkey (+6.0%), Russia (+2.3%), and Iran (+13.4%).
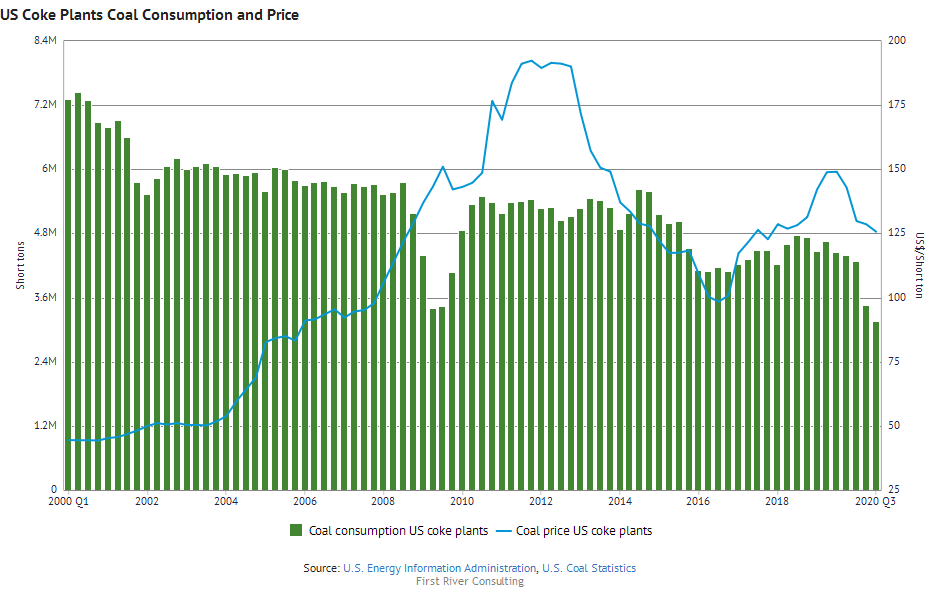
If you are following steelmaking raw materials consumption and pricing, you’ll be interested in this week’s featured dataset, “U.S. Coal Statistics” with data from the U.S. Energy Information Administration (EIA). Here you can find US coal reserves, production, employment, trade and pricing information back to 2000. Related to steelmaking, it includes coking coal pricing, consumption, and inventories, as well as coke import and export quantities and prices.
In the Steel Data Room, it’s easy to make charts, like the one below with quarterly US coking coal consumption (left axis in green) and average coal prices at US coke plants (right axis in blue). You can also combine data from different datasets in one chart. For example, using another Steel Data Room dataset with EIA statistics, “U.S. Natural Gas Stastistics”, you can compare coking coal prices to natural gas prices over time.
Based on reported import licenses, US long products imports rose 9% from 154,000 short tons in December 2019 to 168,000 tons in December this year. Licenses indicate that the rise was mainly due to higher wire rod imports from Brazil, Germany, and Canada.
Full-year 2020 long products imports using December licenses were 14% lower than full-year 2019 imports, with wire rod showing the largest volume decline (-25%), followed by parallel flange sections (-39%). In contrast, 2020 light shapes imports rose 28% on 2019 and structural angles & channels imports rose 70%.
US long products import licenses from ITA Steel Import Monitor
January 2014 to December 2020
Short tons
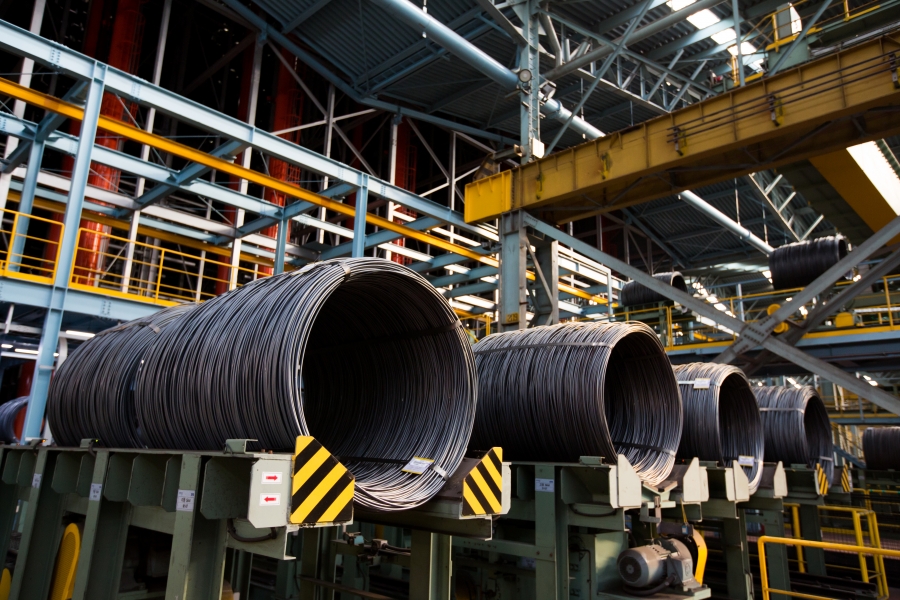
Steel wire rods in a fully automated storage facility at POSCO Pohang Steelworks from Worldsteel Image Library by worldsteel / Seong Joon Cho
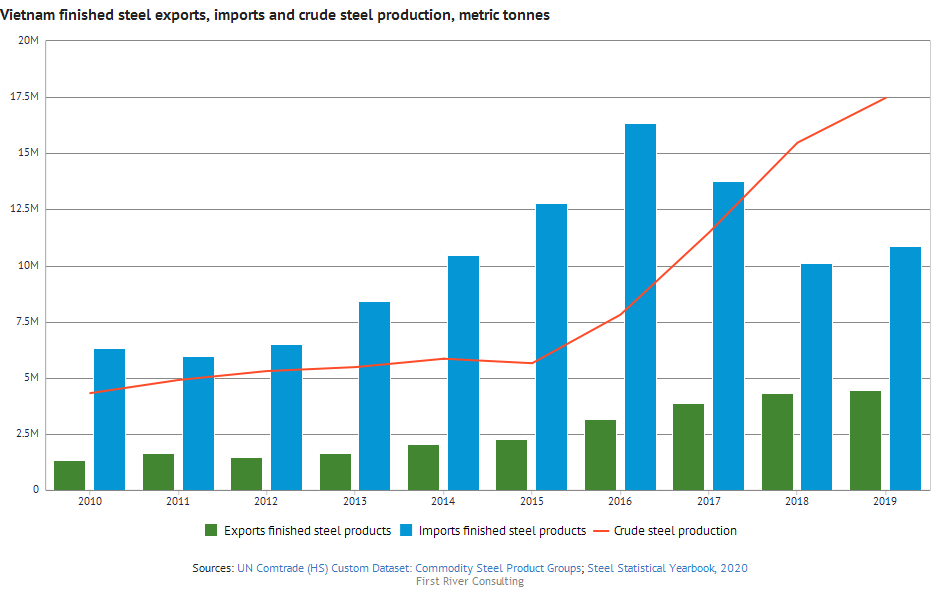
This week’s Steel Data Room dataset of the week looks at the rise in Vietnamese steel production compared to its steel exports and imports. The data comes from United Nations ComTRADE and includes steel products imports and exports by country annually and monthly back to 1988, in volume and value. One of the advantages of this dataset is the steel product categories; First River has organized the trade codes into the main steel product categories so you don’t have to mess around with the harmonized system codes. Just choose hot dip galvanized sheet or rebar.
With this week’s dataset, you can easily create charts like the one below which shows Vietnam’s annual crude steel production from Worldsteel’s Steel Statistical Yearbook compared to it’s finished steel imports and exports. As soon as the 2020 data is published, the chart automatically updates.
Based on reported import licenses, US flat products imports fell 14% from 599,000 short tons in December 2019 to 513,000 tons last month. Cold rolled imports fell by the largest volume, declining 36% on last December due mainly to lower volumes from Mexico, Australia, Canada and Vietnam. Hot roll imports fell by the second largest volume, down 8.7% on last December.
Based on January to November imports and December import licenses, US flat products imports in 2020 were 19% lower than in 2019 with cut plate imports -41%, hot roll -20%, cold roll -25% and hot dip galvanized -10%.
Steel Import Monitor US flat products import licenses
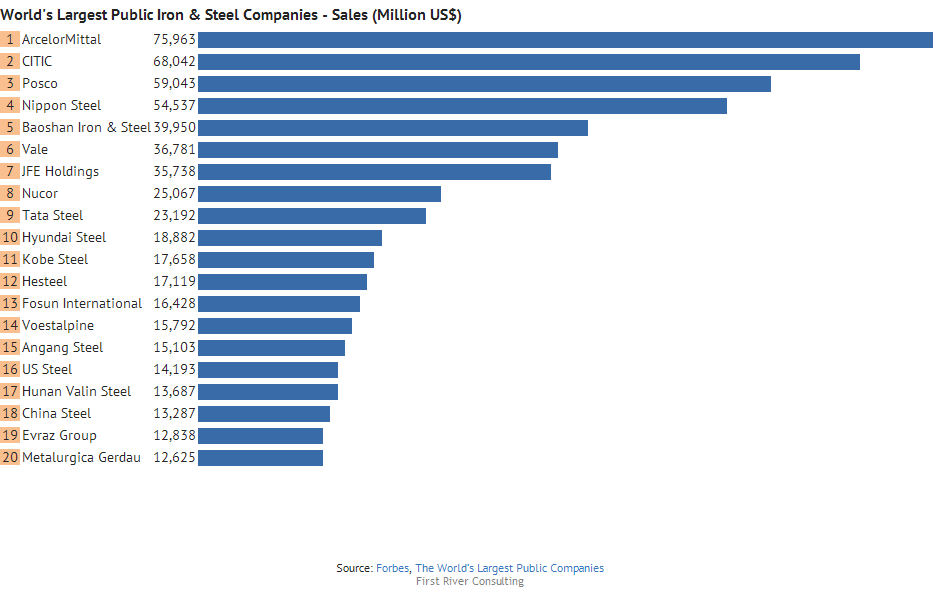
If you are looking to chart financial data on publicly traded steel companies, this week’s dataset is for you. “World’s Largest Public Companies” contains data from Forbes including public company information back to 2010. Results can be filtered by industry (iron & steel, metals & mining, aluminum, trading companies etc.), country, and measure (assets, market value, profits and sales).
The chart below shows ArcelorMittal was the largest iron & steel company by revenue in 2019. Who ranks #1 in market value? You can build that chart and others if you sign up for a free Steel Data Room trial.