Worldsteel reported Chinese crude steel production at 76.7 million metric tonnes in April, 4.8% higher than in April 2017. Chinese output over the first four months of 2018 was 5.2% higher than in the same period last year.
Chinese net finished steel exports (exports minus imports) in April were 5.4 million tonnes, 0.4% higher than in April 2017. Net exports in the first four months of 2018 were 24.3% lower than in the the first four months of 2017.
China monthly crude steel production
January 2006 to April 2018, thousand metric tonnes

Photo by JJ W [CC BY-SA 2.0 (https://creativecommons.org/licenses/by-sa/2.0)], via Wikimedia Commons
Worldsteel published April’s world crude steel production today. World crude steel output was 148.3 million metric tonnes, 4.1% higher than in April 2017. Crude production in the first four months of 2018 was 4.1% higher than in the same period last year.
China accounted for 52% of world output in April with production of 76.7 million tonnes, 4.8% higher than in April 2017. Asian countries outside of China increased production by 2.7%, following increases in India (+5.6%), South Korea (+7.1%), and Vietnam (+24.6%), but despite a decline in Taiwan (-14.6%). European Union production rose 3.4% and NAFTA output rose 6.4% with increases in all three participating countries (US +13.7%, Canada +13.8%, Mexico +3.6%). Also notable was a 12.4% rise in Iran.

Close-up of hot slab in the continuous casting process
Photo from Worldsteel Association Image Library by worldsteel / Gregor Schläger, Image ref. worldsteel_thyssenkrupp-steel_germany_casting_7.jpg
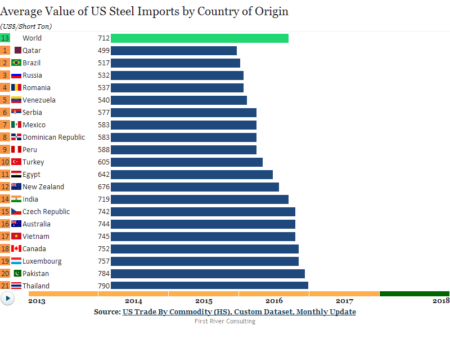
Another revealing dynamic ranking chart from the Steel Data Room shows you how the average value of US steel imports per ton have changed over time by country. Watch the dynamic version here or register to create you own. Includes carbon & alloy semi-finished, flat & long finished products only. No stainless, no pipe & tube.
Based on reported import licenses, US long products imports rose 30% from 336,000 short tons in March to 436,000 tons in April. This was mainly due to higher rebar imports from Turkey and higher parallel flange sections imports from Korea and Taiwan.
Long products imports in the first four months of 2018 were 28% lower than in the same period last year, led by a 35% drop in rebar imports and a 35% fall in wire rod imports.
SIMA US long products import licenses
2012 to 2018
short tons
Photo by W.carter [CC BY-SA 4.0 (https://creativecommons.org/licenses/by-sa/4.0)], from Wikimedia Commons
This dynamic ranking chart shows you how China grew from the world’s third largest steel producer in 1992 to number one in 1996 and beyond. And how India rose from number ten in 1992 to number three in 2016.
Register for free in the Steel Data Room, and you can quickly set up dynamic charts like this one, where a click on the Play button will illustrate how the steel world has changed over the last 25 years.
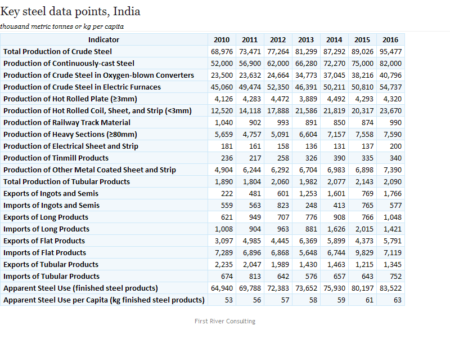
In the Steel Data Room, you can easily put everything you ever wanted to know about your country’s steel industry in one beautiful table, like this one for India. And with one click, you can quickly change countries. Start your free trial to find out just how fast.