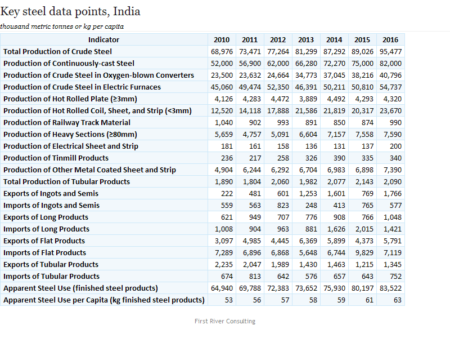
In the Steel Data Room, you can easily put everything you ever wanted to know about your country’s steel industry in one beautiful table, like this one for India. And with one click, you can quickly change countries. Start your free trial to find out just how fast.
Fantastic charts explain a lot, even using familiar data. This one shows US steel trade, imports & exports, by product using Worldsteel data. Find out more about the Steel Data Room, where charts are automatically updated as soon as new data is published.

Based on reported import licenses, US flat steel products imports rose 16% from 972,000 short tons in March to 1,124,000 tons in April. Hot dip galvanized imports increased the most compared to other products, with significantly higher volumes from Russia, Turkey, Brazil and South Africa.
Flat products imports in the first four months of 2018 were 8% higher than in the same period last year, driven mainly by a 42% increase in hot rolled imports, which was offset by declines in cold roll and hot dip galvanized imports.
SIMA US flat products import licenses
January 2013 to April 2018
short tons

Photo by LHOON from Mechelen, Belgium (Loading coils) [CC BY-SA 2.0 (https://creativecommons.org/licenses/by-sa/2.0)], via Wikimedia Commons
When the world gets complicated, you need tools up to the task of helping you understand what’s going on. The First River Steel Data Room is where we keep ours.

Q1 2018 financial results for five companies have been added to the Nerds of Steel earnings spreadsheet. The companies we added and the Q1 2018 EBITDA/ton for each are shown below.
CMC: $63, down from $74 in Q4 2017
SSAB: $109, up from $77 in Q4
Ternium: $171, up from $127 in Q4
TimkenSteel: $50, up from $13 in Q4
US Steel: $64, down from $72 in Q4
Worldsteel reported Chinese crude steel production at 74.0 million metric tonnes in March, 4.5% higher than in March 2017. Chinese output over the first three months of 2018 was 5.4% higher than in the same period last year.
Chinese net finished steel exports (exports minus imports) in March were 4.4 million tonnes, 29.4% lower than in March 2017. Net exports in the first quarter of 2018 were 32.1% lower than in the first quarter of 2017.
China monthly crude steel production
January 2006 to March 2018, thousand metric tonnes

Photo by Mk2010 [CC BY-SA 4.0 (https://creativecommons.org/licenses/by-sa/4.0)], from Wikimedia Commons


