Worldsteel published March’s world crude steel production today. World crude steel output was 148.3 million metric tonnes, 4.0% higher than in March 2017. Crude production in the first three months of 2018 was 4.1% higher than in the same period last year.
China accounted for 50% of world output in March with production of 74.0 million tonnes, 4.5% higher than in March 2017. Other countries in Asia with increasing output compared to last March include India (+5.3%), South Korea (4.7%) and Japan (+2.2%). In the Americas, US production rose 5.3% March-on-March, and Brazilian output was up 7.6%. In Europe, EU production rose 0.5% and Russian output fell 10.0%. And finally, Turkish output increased by 7.6% and Iranian output by 43.7%.
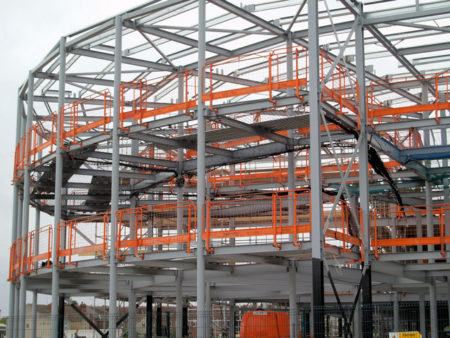
Photo by Steve F [CC BY-SA 2.0 (https://creativecommons.org/licenses/by-sa/2.0)], via Wikimedia Commons
Nucor and Steel Dynamics announced Q1 2018 earnings this week and both companies posted strong EBITDA per ton. Nucor’s EBITDA per ton rose to $116 from $94 in Q4 last year, while Steel Dynamics rsoe to $158 from $115.
In its latest Short Range Outlook (SRO), published yesterday, Worldsteel revised its world apparent steel use (ASU) growth forecast for 2018 upward. The revision increased estimated world steel demand growth between 2017 and 2018 from 1.6% in its October 2017 Short Range Outlook to 1.8% in the recent published figures.
China accounted for 46.4% of world steel demand in 2017 and while China’s ASU was expected to grow by 12.4% in 2017, demand actually grew by 8.3%. And in 2018, China’s ASU is still expected to show 0% growth, as already forecast in the October SRO. 2019 demand in China is expected to fall by 2.0%.
For the world outside of China, ASU grew more slowly than expected in 2017, by 1.8% instead of the forecast 2.6%. However, the new forecast revises 2018 demand outside of China up from 3.0% to 3.4% with revised higher 2018 demand in EU, NAFTA, Central & South America, and African regions.
See the spreadsheet below for Worldsteel 2018 and 2019 growth estimates together with all the Worldsteel Short Range Outlook figures over the last few years.

Photo of World Trade Center facade 2008 by urrrric (7 World Trade Center) [CC BY 2.0 (https://creativecommons.org/licenses/by/2.0)], via Wikimedia Commons
Based on reported import licenses, US long products imports rose 45% from 266,000 short tons in February to 387,000 tons in March. The steep climb between February and March 2018 was due to higher rebar imports from Turkey (and bearing in mind the longer March month).
Long products imports in the first quarter of 2018 were 34% lower than in the same period last year, led by a 51% drop in rebar imports and a 31% fall in wire rod imports.
SIMA US long products import licenses and actuals
2012 to 2018
short tons
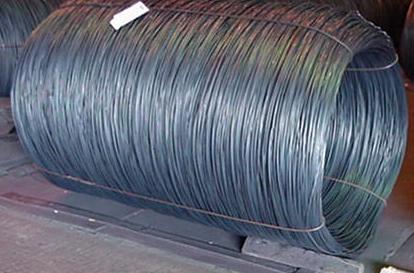
Photo by druida [Public domain], from Wikimedia Commons
Based on reported import licenses, US flat steel products imports rose 38% from 709,000 short tons in February to 978,000 tons in March. Hot rolled imports increased the most compared to other product categories, with higher volumes mainly from Canada, South Korea and Turkey.
Flat products imports in the first three months of 2018 were 1% higher than in the same period last year, though a 38% increase in hot rolled imports offset a 21% decline in cold rolled imports and a 13% drop in hot dip galvanized imports.
SIMA US flat products import licenses and actuals
January 2013 to March 2018
short tons
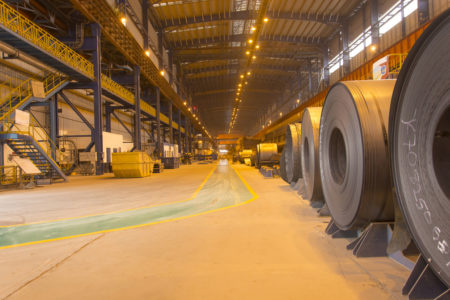
Hot Strip Mill, Tata Steel Kalinganagar
Photo from Worldsteel Association Image Library by worldsteel_Prasenjeet Gautam, image ref. worldsteel_Tata Steel_India_Hot Rolling_2.jpg
Worldsteel reported Chinese crude steel production at 64.9 million metric tonnes in February, 5.9% higher than in February 2017. Chinese net finished steel exports (exports minus imports) in February were 3.8 million tonnes, 17.6% lower than in February last year.
China monthly crude steel production
January 2006 to February 2018, thousand metric tonnes

Photo by Prof. Chen Hualin (Own work) [CC BY-SA 4.0 (https://creativecommons.org/licenses/by-sa/4.0)], via Wikimedia Commons


