Based on reported import licenses, US long products imports showed little change between September and October, falling 1% from 329,000 short tons in September to 326,000 tons in October. Licenses indicate lower rebar imports in October due to declining volumes from Spain, Italy and Brazil, and despite higher rebar imports from Turkey. The decline in rebar imports was offset by higher All Other Structural Shapes imports, however, resulting in flat total longs imports month-on-month.
Long products imports for the first ten months of 2017 were 8% lower than in the same period last year, driven largely by lower rebar imports.
SIMA US long products import licenses and actuals
2012 to 2017
short tons
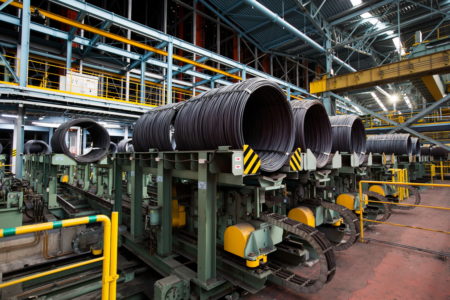
Steel wire rod in a fully automated storage facility
Photo from Worldsteel Association Image Library by worldsteel / Seong Joon Cho, Image ref: worldsteel_posco_south-korea_hot-rolling_3.jpg
ArcelorMittal posted Q3 earnings today and the results have been added to the graph and spreadsheet below. The company’s EBITDA per ton dropped slightly to $80 in the quarter from $91 in Q2.
Sorry for the delay in getting this post out. Nine companies we follow have released Q3 2017 financial results. Most of the mills reported EBITDA per ton that was similar to or lower than was reported in Q2 of this year. The lowest EBITDA per ton was reported by CMC, $25, and the highest was reported by Steel Dynamics, $141. See the graph below and the chart behind the graph for more details.
Based on reported import licenses, US flat steel products imports rose 4% from 834,000 short tons in September to 866,000 tons in October. Flat products imports for the first ten months of 2017 were 2% lower than in the first ten months of 2016. However, comparing the first ten months of 2017 to 2016 by product, the decline in hot rolled imports (-18%) and cut plate imports (-38%) was offset by an increase in cold rolled imports (+25%) and hot dip galvanized imports (+17%).
Imports rose between September and October mainly due to higher hot rolled imports including increases from Canada. Cold rolled and cut plate imports also rose between September and October but hot dip galvanized imports fell due to lower volumes mainly from Turkey and Brazil.
SIMA US flat products import licenses and actuals
January 2013 to October 2017
short tons

Photo by Methem (Mikko J. Putkonen) (Own work) [CC BY 3.0 (http://creativecommons.org/licenses/by/3.0)], via Wikimedia Commons
Worldsteel reported Chinese crude steel production at 71.8 million metric tonnes in September, 5.3% higher than in September 2016. Chinese crude output for the first nine months of 2017 was 5.5% higher than in the same period last year.
Chinese net finished steel exports (exports minus imports) in September were 3.9 million tonnes, 49.2% lower than in September 2016. Chinese net finished steel exports over the first nine months of 2017 were 34.4% lower than in the first nine months of 2016.
China monthly crude steel production
January 2006 to September 2017, thousand metric tonnes

Photo by Siyuwj (Own work) [CC BY-SA 4.0 (https://creativecommons.org/licenses/by-sa/4.0)], via Wikimedia Commons
The Eurofer Q4 Economic & Steel demand outlook 2017-18. Click on the image below to go to the full report.


