Worldsteel published September’s world crude steel production yesterday. World crude steel output was 141.4 million metric tonnes, 5.6% higher than in September 2016. World production for the first nine months of 2017 was 5.3% higher than in the same period last year.
China accounted for 51% of world output in September with production of 71.8 million tonnes, 5.3% higher than in September 2016. Production also rose in other Asian countries including Taiwan (+12.3%), Japan (+2.0%), South Korea (+2.8%), India (+1.9%) and Vietnam (+33.8%). In the Americas, US output increased 8.6% compared to last September and Brazilian output rose 7.6%. Crude production in the European Union rose 2.7%, with strong increases from Germany (+8.1%) and Italy (+8.3%). And in other parts of Europe and the Middle East, Turkish production rose 13.0%, Russian output gained 5.8% and Iranian output increased 40.4%.
All the data for September 2017 and for a number of prior years can be found in the Nerds spreadsheet below.
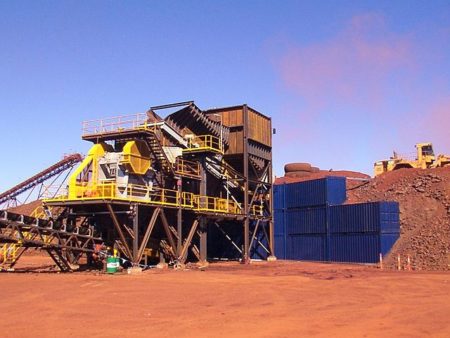
Photo by Surfing_bird (talk) (Uploads) – Own work, CC BY 3.0, https://en.wikipedia.org/w/index.php?curid=19224242
Based on reported import licenses, US long steel products imports fell 3% from 333,000 short tons in August to 324,000 tons in September. Long products imports in the first nine months of 2017 were 6% lower than in the same period last year, driven entirely by lower rebar imports while imports of all other product categories rose. Wire rod imports in particular showed a 9% increase in first nine month of 2017 compared to last year.
SIMA US long products import licenses and actuals
2012 to 2017
short tons

Photo by Matt Billings (piano strings) [CC BY 2.0 (http://creativecommons.org/licenses/by/2.0)], via Wikimedia Commons
In its latest Short Range Outlook (SRO), published October 16th, Worldsteel revised its world apparent steel use (ASU) growth forecast upward. The revision increased estimated world steel demand growth between 2016 and 2017 from 1.3% in its April 2017 Short Range Outlook to 7.0% in the recent published figures. In addition, it revised the demand growth between 2017 and 2018 from 0.9% in its April estimate to 1.6%.
Worldsteel points out that a significant portion of the 2017 increase in the demand growth forecast reflects the formerly unreported demand from Chinese induction furnaces closed in 2017 which are now regularly reported. However, ignoring this one-off effect, Chinese demand in 2017 is expected to grow by 3.0%, still higher than Worldsteel’s 0% forecast for China made in April, and outside of China, demand in 2017 is expected to grow 2.6%, again higher than Worldsteel’s 2.4% forecast in April.
Outside of China, the regions driving higher 2017 steel demand growth include the European Union (2.5% demand growth compared to 0.5% in the April forecast), NAFTA (4.9% demand growth compared to 2.2% in the April forecast), and the CIS (3.6% compared to 3.2% in April). In contrast, the steel demand forecasts for Central & South America, the Middle East, and Africa were each lowered.
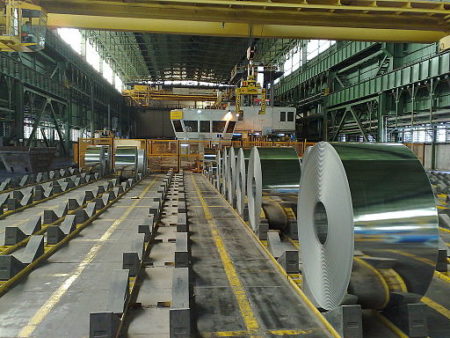
Photo from https://commons.wikimedia.org/wiki/File%3AFoolad_Mobarakeh50.jpg “by myself (Own work)” [CC BY-SA 3.0 (https://creativecommons.org/licenses/by-sa/3.0)], via Wikimedia Commons
Based on reported import licenses, US flat steel products imports fell 10% from 912,000 short tons in August to 821,000 tons in September. Flat products imports for the first nine months of 2017 were 2% lower than in the first nine months of 2016. However, comparing the first nine months of 2017 to 2016 by product, the decline in hot rolled imports (-19%) and cut plate imports (-42%) was offset by an increase in cold rolled imports (+27%) and hot dip galvanized imports (+22%).
Imports dropped between August and September due to lower hot dip galvanized imports from Thailand, Brazil, and Russia, as well as reduced volumes of cold rolled imports from Turkey and Australia.
SIMA US flat products import licenses and actuals
January 2013 to September 2017
short tons
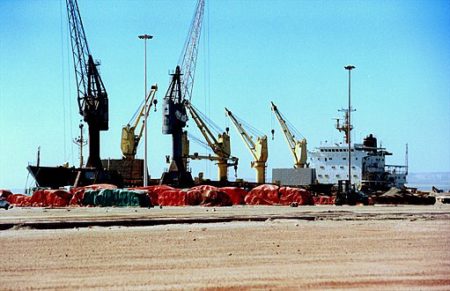
Photo by Bob Adams from George, South Africa (Bulker loading steel at Saldanha Bay.) [CC BY-SA 2.0 (https://creativecommons.org/licenses/by-sa/2.0)], via Wikimedia Commons
Worldsteel reported Chinese crude steel production at 74.6 million metric tonnes in August, 8.7% higher than in August 2016. Chinese crude output for the first eight months of 2017 was 5.6% higher than in the same period last year.
Chinese net finished steel exports (exports minus imports) in August were 5.5 million tonnes, 30.0% lower than in August 2016. Chinese net finished steel exports over the first eight months of 2017 were 32.7% lower than in the first eight months of 2016.
China monthly crude steel production
January 2006 to August 2017, thousand metric tonnes
 Photo by Andreas Habich (Own work) [CC BY-SA 3.0 (https://creativecommons.org/licenses/by-sa/3.0)], via Wikimedia Commons
Worldsteel published August’s world crude steel production on September 21st. World crude steel output was 143.6 million metric tonnes, 6.3% higher than in August 2016. World production for the first eight months of 2017 was 4.9% higher than in the same period last year.
China accounted for 52% of world output in August with production of 74.6 million tonnes, 8.7% higher than in August 2016. Also in Asia, Indian output was up 4.1%, South Korean output rose 4.9%, and Vietnamese production increased 57.8%. European Union production rose 3.6% while Turkish output rose 13.3%. In the CIS, Russian crude production fell 5.0% and Ukrainian output declined 5.5%. And in the Americas, US production rose 6.3% compared to last August and Canadian output increased 11.3%.
All the data for August 2017 and for a number of prior years can be found in the Nerds spreadsheet below.
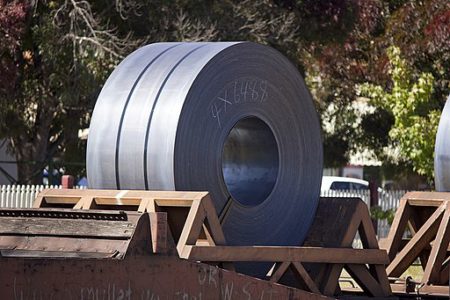
Photo by Bidgee [CC BY-SA 3.0 au (https://creativecommons.org/licenses/by-sa/3.0/au/deed.en)], via Wikimedia Commons


