In its latest Short Range Outlook (SRO), published April 21st, Worldsteel revised its world apparent steel use (ASU) growth forecast upward. The revision increased estimated world steel demand growth between 2016 and 2017 from 0.5% in its October 2016 Short Range Outlook to 1.3% in the recent published figures.
While China’s ASU was expected to fall by 1.0% in 2016, demand actually grew by 1.3%. And in 2017, China’s ASU is now expected to remain flat instead of falling by 2.0% as forecast in the October SRO. However, demand in China is now expected to drop by 2.0% in 2018.
For the world outside of China, ASU grew more slowly than expected in 2016, by 0.7% instead of the forecast 1.1%. And the new forecast revises 2017 demand outside of China down from 2.6% to 2.4%. This is due to lower 2017 growth estimates in the European Union (0.5% instead of 1.4%), NAFTA (2.2% instead of 2.9%), Central & South America (3.5% instead of 4.1%), and Africa (1.5% instead of 3.9%). In contrast, the 2017 ASU growth forecast was revised upward in non-China Asia (3.2% instead of 3.0%), the CIS (3.2% instead of 2.1%) and the Middle East (3.1% intead of 0.1%).
See the downloadable spreadsheet below for Worldsteel 2017 and 2018 growth estimates together with all the Worldsteel Short Range Outlook figures over the last few years.
Nucor and Steel Dynamics reported Q1 earnings this week. Both companies reported significant improvements in EBITDA per ton. Nucor’s rose to $124 in Q1 up from $110 in Q4 2016 and Steel Dynamics recorded $165 in the latest quarter, up slightly from $162 in Q4 last year. More results will be released in the next few weeks so stay tuned.
Based on reported import licenses, US long products imports rose 39% from 392,000 short tons in February to 546,000 tons in March. Long products imports for the first three months of 2017 were 3% higher than in the same period last year with rebar increasing the most (10%) and parallel flange sections showing the largest decline (-31%).
The increase between February and March (bearing in mind the longer March month) was mainly due to higher rebar imports from Turkey, though rebar imports from Portugal and Vietnam also rose. Wire rod imports also rose significantly month-on-month due to higher imports from Turkey, Canada, and Japan.
SIMA US long products import licenses and actuals
2012 to 2017
short tons
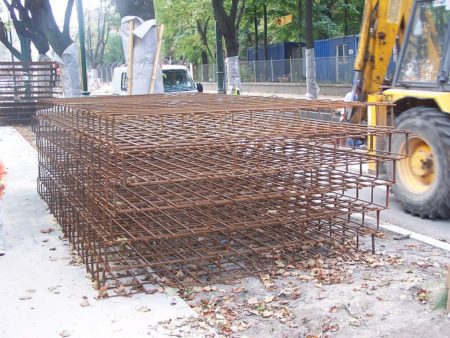
Photo: No machine-readable author provided. Piotrus assumed (based on copyright claims). Via Wikimedia Commons
Based on reported import licenses, US flat products imports rose 7% from 719,000 short tons in February to 772,000 tons in March. Flat products imports for the first three months of 2017 were 10% lower than in the same period last year with cut plate and hot roll imports falling significantly (by 53% and 38% respectively) but cold roll and hot dip galvanized imports rising (by 43% and 23% respectively).
The increase in flats imports between February and March was mainly due to higher hot rolled imports from Japan and Canada.
SIMA US flat products imports licenses and actuals
January 2013 to March 2017
short tons
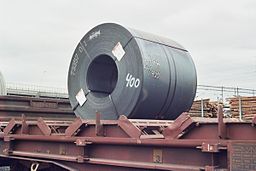
Photo by Methem (Mikko J. Putkonen) (Own work) [Public domain], via Wikimedia Commons
Worldsteel reported Chinese crude steel production at 61.2 million metric tonnes in February, 4.6% higher than in February 2016, even though February 2016 was one day longer. China’s net finished steel exports (exports minus imports) in February were about 4.6 million tonnes, 35% lower than in February 2016.
China monthly crude steel production
January 2005 to February 2017, thousand metric tonnes

Photo by Glabb (Own work) [CC BY-SA 3.0 (http://creativecommons.org/licenses/by-sa/3.0)], via Wikimedia Commons
Worldsteel published February’s world crude steel production yesterday. World crude steel output was 126.6 million metric tonnes, 4.1% higher than in February 2016, though February 2016 was one day longer.
China accounted for 48% of world output in February with production of 61.2 million tonnes, 4.6% up on February 2016. Asian crude production outside of China rose 6.4% led by an 8.9% increase in India and an 8.3% increase in South Korea. European Union production fell 0.6% while Turkish output rose 15.6%. In the Americas, US crude production fell 1.0% but Mexican output rose 7.0% and Brazilian production was up 5.7%.
All the data for February 2017 and for a number of prior years can be found in the Nerds spreadsheet below.

Photo by Keith Evans [CC BY-SA 2.0 (http://creativecommons.org/licenses/by-sa/2.0)], via Wikimedia Commons


